1. miRNA-Target
The "miRNA-Target" module provides the most comprehensive miRNA-mRNA, miRNA-lncRNA, miRNA-pseudogene, miRNA-circRNA, and miRNA-sncRNA interaction networks in different cell lines, tissues in different conditions. Here, we provide two examples to show how to use the module to explore the miRNA-ncRNA and miRNA-RNA interactions supported by Ago CLIP-seq experiments.
1-1 How many mRNAs could interact with hsa-miR-21-5p?
A particular miRNA can pair specifically with several target mRNAs performing different biological functions. How could we know the mRNAs that interact with the interested miRNA? Here, take "hsa-miR-21-5p" (in human) which has been reported to interact with PDCD4 as an example (Fig.1-1a):
1. Choose the miRNA-mRNA sub-module under "miRNA-Target" module.
2. In the left sidebar:
a) Select the genome: clade (mammal), genome (human), assembly (hg19).
b) Click "miRNA" parameter and input "hsa-miR-21-5p" (official miRNA ID) in the opened box.
c) By default, the "target" parameter is "all".
d) Change the filters of interests. Here we use a set of stringent parameters to refine our results: CLIP evidence (>=5), degradome evidence (>=1), Pan-Cancer (>=10), program number (>=5) and predicted program (None). You can browse more detailed explanation of parameters (Table.1-1). And we filter out 8 mRNAs. By default, the results are sorted by CLIP-seq data number.
Note: You can also follow the steps and perform the same operation using the "Quick Search" under the navigation bar, and you need to click "Quick Search" button to submit the query.
3. Click the highlighted non-zero characters to browse more details. For example, click 1[28,0] in the microT column, you can get more details about the binding site of hsa-miR-21-5p on PDCD4 predicted by DIANA-microT software. You can also click the highlighted characters in this chart, such as 28 (Fig.1-1b).
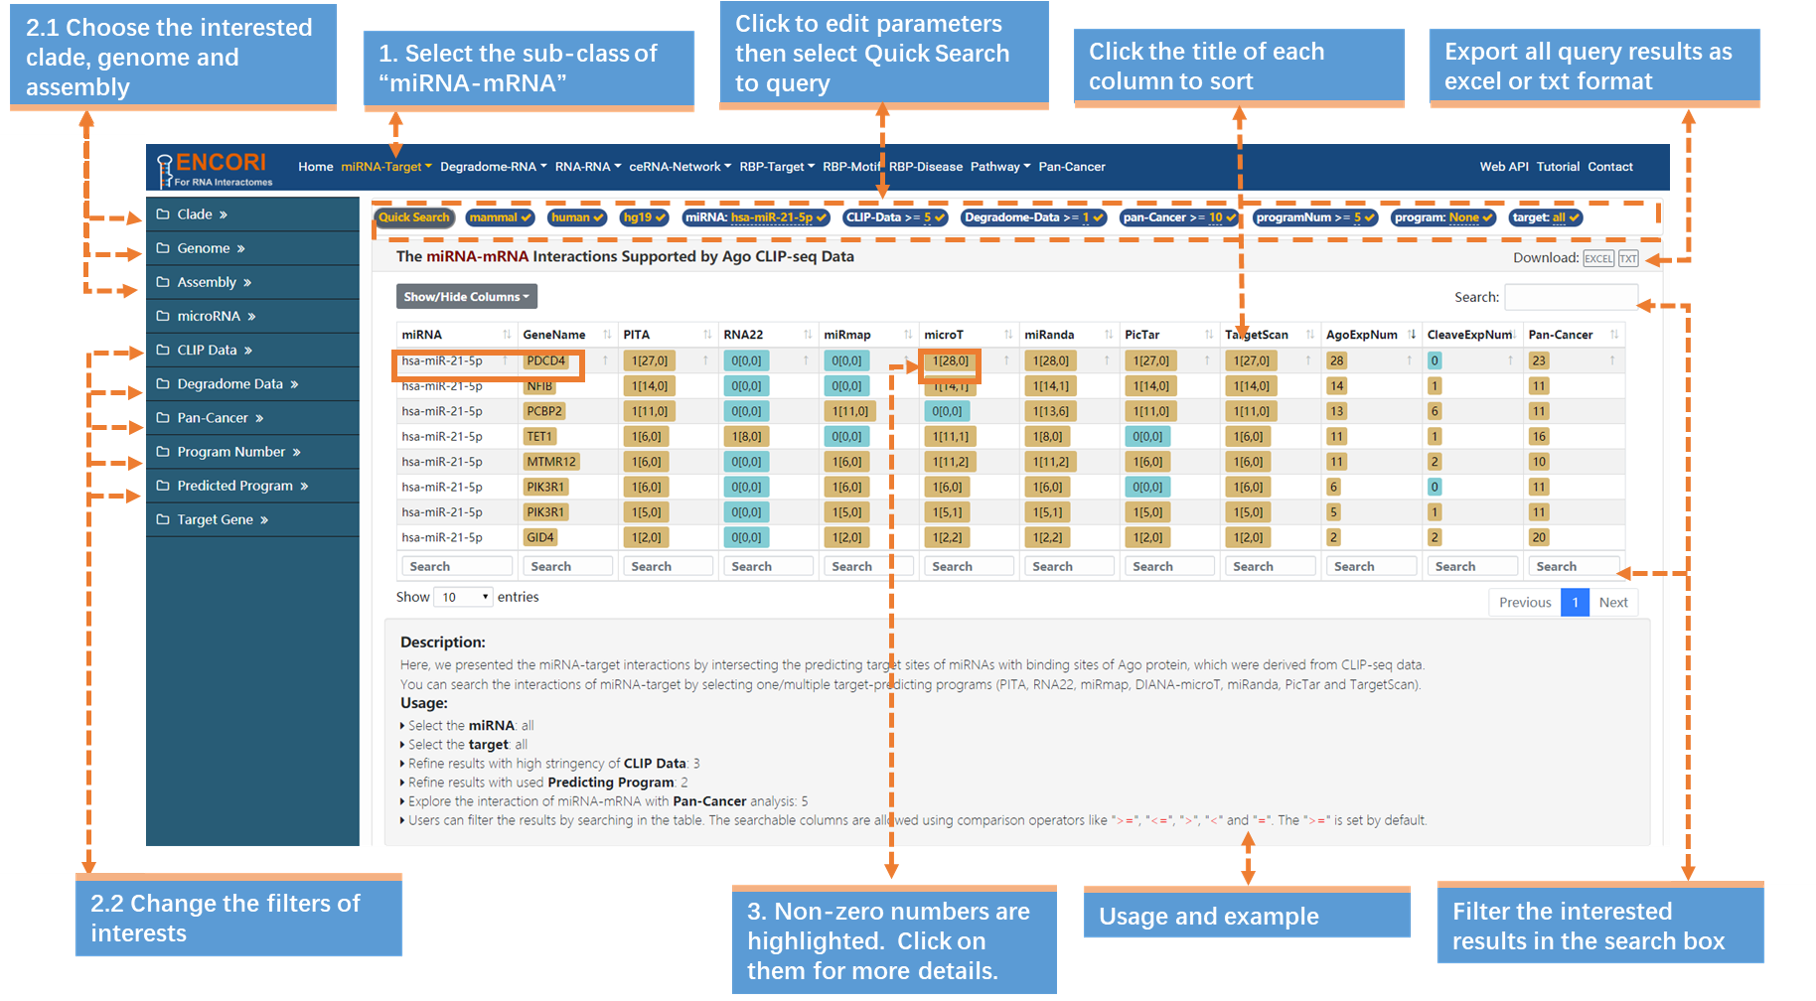
Fig.1-1a The "hsa-miR-21-5p"-mRNA interactions supported by degradome-seq data
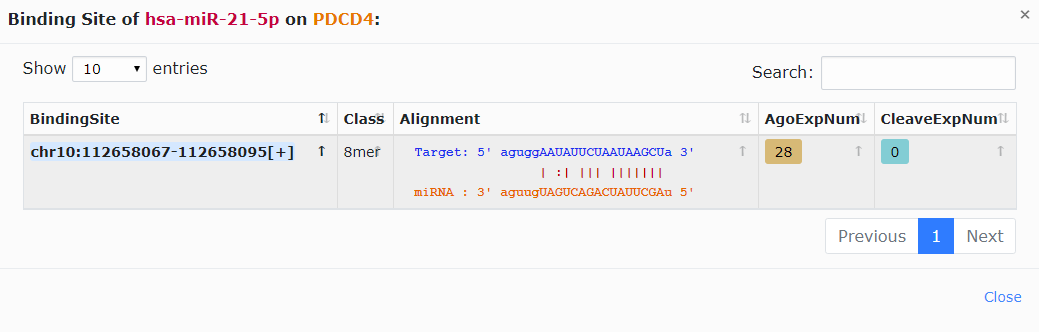
Fig.1-1b Details about the binding site of hsa-miR-21-5p on PDCD4 predicted by DIANA-microT software
| Parameters in the sidebar | |
|---|---|
| Parameter | Explanation |
| CLIP Data | The number of supporting CLIP-seq experiments can be adjusted to control the stringency of the predictions. |
| Degradome Data | The number of degradome-seq data can be adjusted to control the stringency of the predictions. |
| Pan-Cancer | Number of Cancer types (Pan-Cancer) that miRNA-target show anti-correlation relationships (pearson correlation: r<0, p-value<0.05). |
| Program Number | The Number of target-predicting programs. And this option is restrained by the Predicted Program option. |
| Predicted Program | MicroRNA target-predicting programs, including PITA, RNA22, miRmap, DIANA-microT, miRanda, PicTar and TargetScan. |
| Parameters in the Quick Search | |
| Parameter | Explanation |
| microRNA | Users are allowed to input "all" or a specific microRNA. |
| Columns in the results table | |
| Column | Explanation |
| miRNAID | Click to link to miRBase. |
| GeneID | Select to link to ENSEMBL database. |
| GeneName | Click to browse binding region on transcripts. |
| TargetSite (Narrow) | Overlapped part of stacked target region (across target-predicting programs). Link to UCSC genome browser. |
| TargetSite (Broad) | The full range of stacked target region (across target-predicting programs). Link to UCSC genome browser. |
| miRanda | Number of target sites[AgoExpNum, CleaveExpNum]. Click to browse microRNA-predicted binding site. |
| AgoExpNum | Number of supporting Ago CLIP-seq experiments. Click to browse binding sites of Ago protein on gene. |
| CleaveExpNum | Number of supporting degradome-seq experiments. Select to browse cleavage sites on gene. |
| AGOStats | Argonaute proteins invovled in miRNA-target interaction. |
| Pan-Cancer | Click to access Pan-Cancer analysis results. |
| Accession | Click to link to GEO database. |
| Reference | Select to browse referenced paper. |
Table.1-1 Explanation of parameters in the sidebar, Quick Search and results table
1-2 How many miRNAs may target PDCD4 gene?
A single mRNA can be recognized and regulated by multiple miRNAs. In most cases, we want to figure out our target gene can be potentially regulated by how many miRNAs. Take PDCD4 gene (in human) as an example (Fig.1-2):
1. Choose the miRNA-mRNA sub-module under "miRNA-Target" module.
2. Select the genome with left sidebar features: clade (mammal), genome (human), assembly (hg19).
3. In the "Quick Search" under the navigation bar:
a) Click "miRNA" parameter and input "all" in the box.
b) Click "target" parameter and input "PDCD4" (official gene symbol) in the box.
c) Click "Quick Search" button to submit the query.
4. Change the filters of interests in the left sidebar. Here we use a set of stringent parameters to refine the results: CLIP evidence (>=5), degradome evidence (>=0), Pan-Cancer (>=6), program number (>=4) and predicted program (None). And we filter out 21 miRNAs. By default, the results are sorted by CLIP-seq data number.
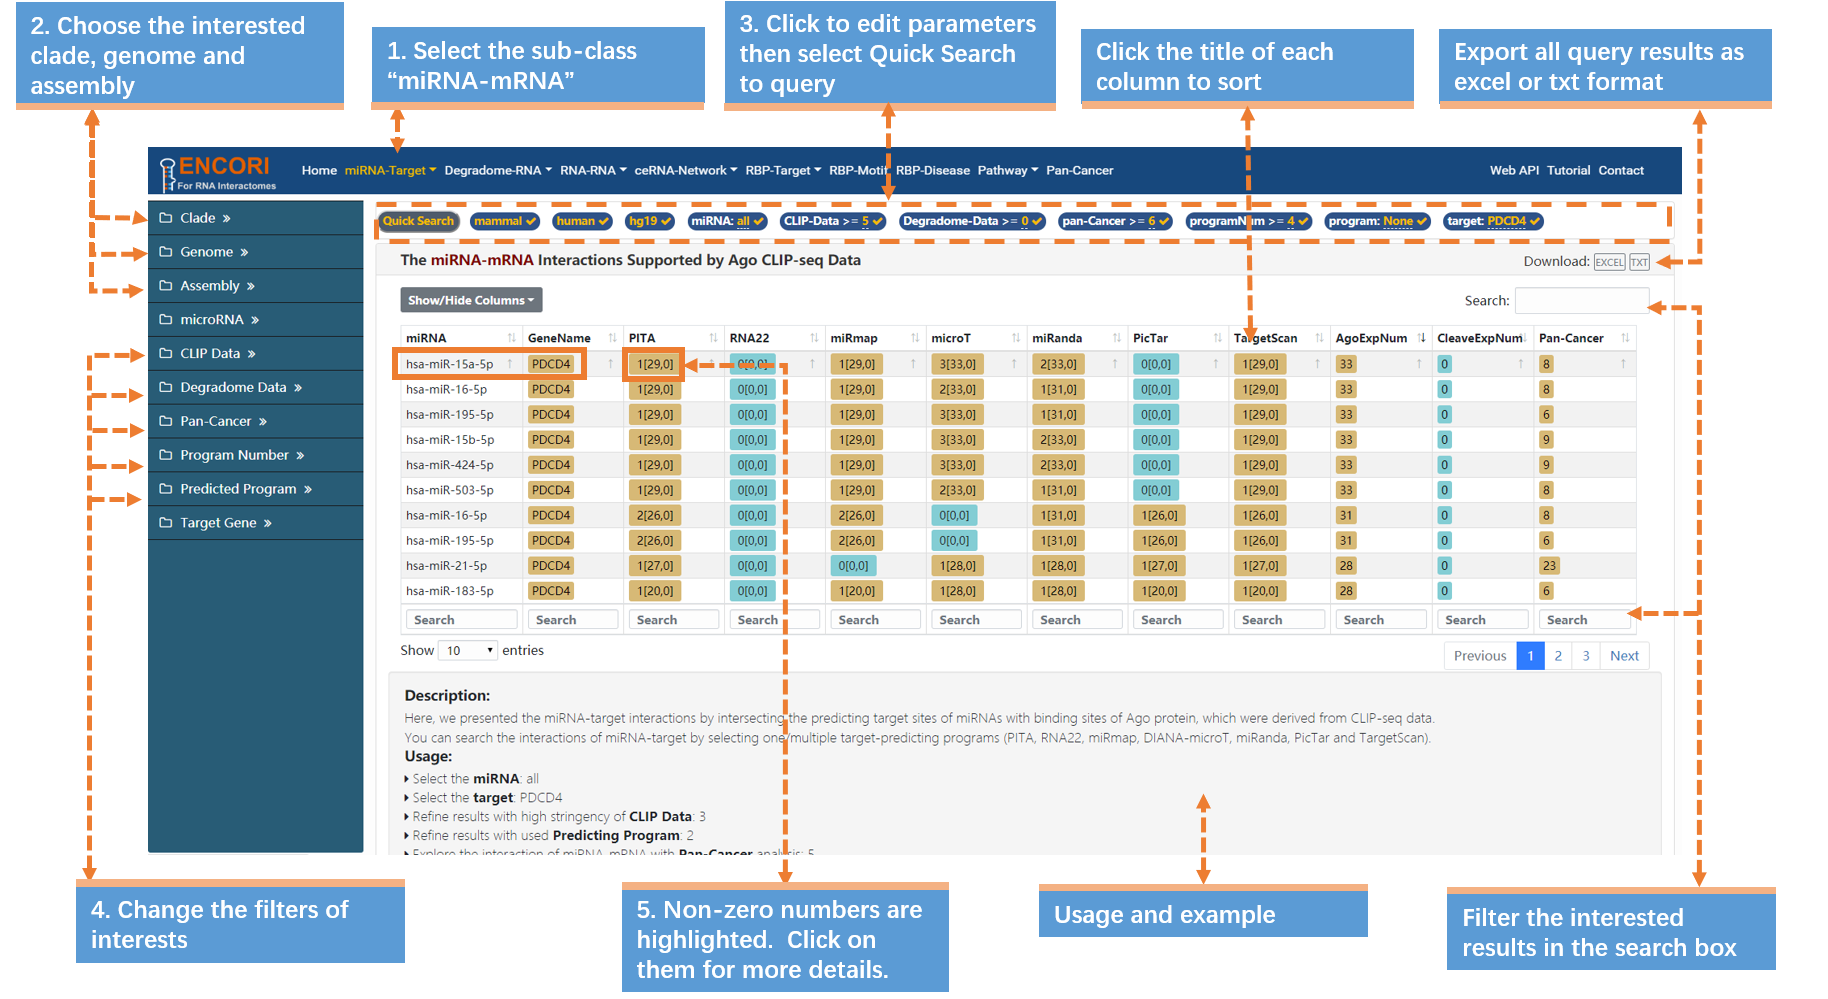
Fig.1-2 The miRNA-PDCD4 interactions supported by Ago CLIP-seq data
1-3 How many miRNAs may target circRNA HIPK3?
The identification and characterization of circRNA have recently reshaped the RNA world. And the biological functions of cirRNAs suggest a novel mechanism for regulating microRNAs. Here, we instance HIPK3 (in human), which is directly binds to miR-124 and inhibits miR-124 activity, to explore miRNA-cirRNA interactions (Fig.1-3):
1. Choose the miRNA-circRNA sub-module under "miRNA-Target" module.
2. Select the genome with left sidebar features: clade (mammal), genome (human), assembly (hg19).
3. In the "Quick Search" under the navigation bar:
a) Click "miRNA" parameter and input "all" in the opened box.
b) Click "target" parameter and input "HIPK3" (official circRNA Symbol) in the box.
c) Click "Quick Search" button to submit the query.
4. Change the filters of interests in the sidebar to refine the results: CLIP evidence (>=3) and degradome evidence (>=0). You can get more detailed explanation of parameters (Table.1-3). By default, the results are sorted by CLIP-seq data number.
5. Filter the interested results in the search box. Input ">=4" in the search box of AgoExpNum column to filter the results. Then click the title of the AgoExpNum column to resort results.
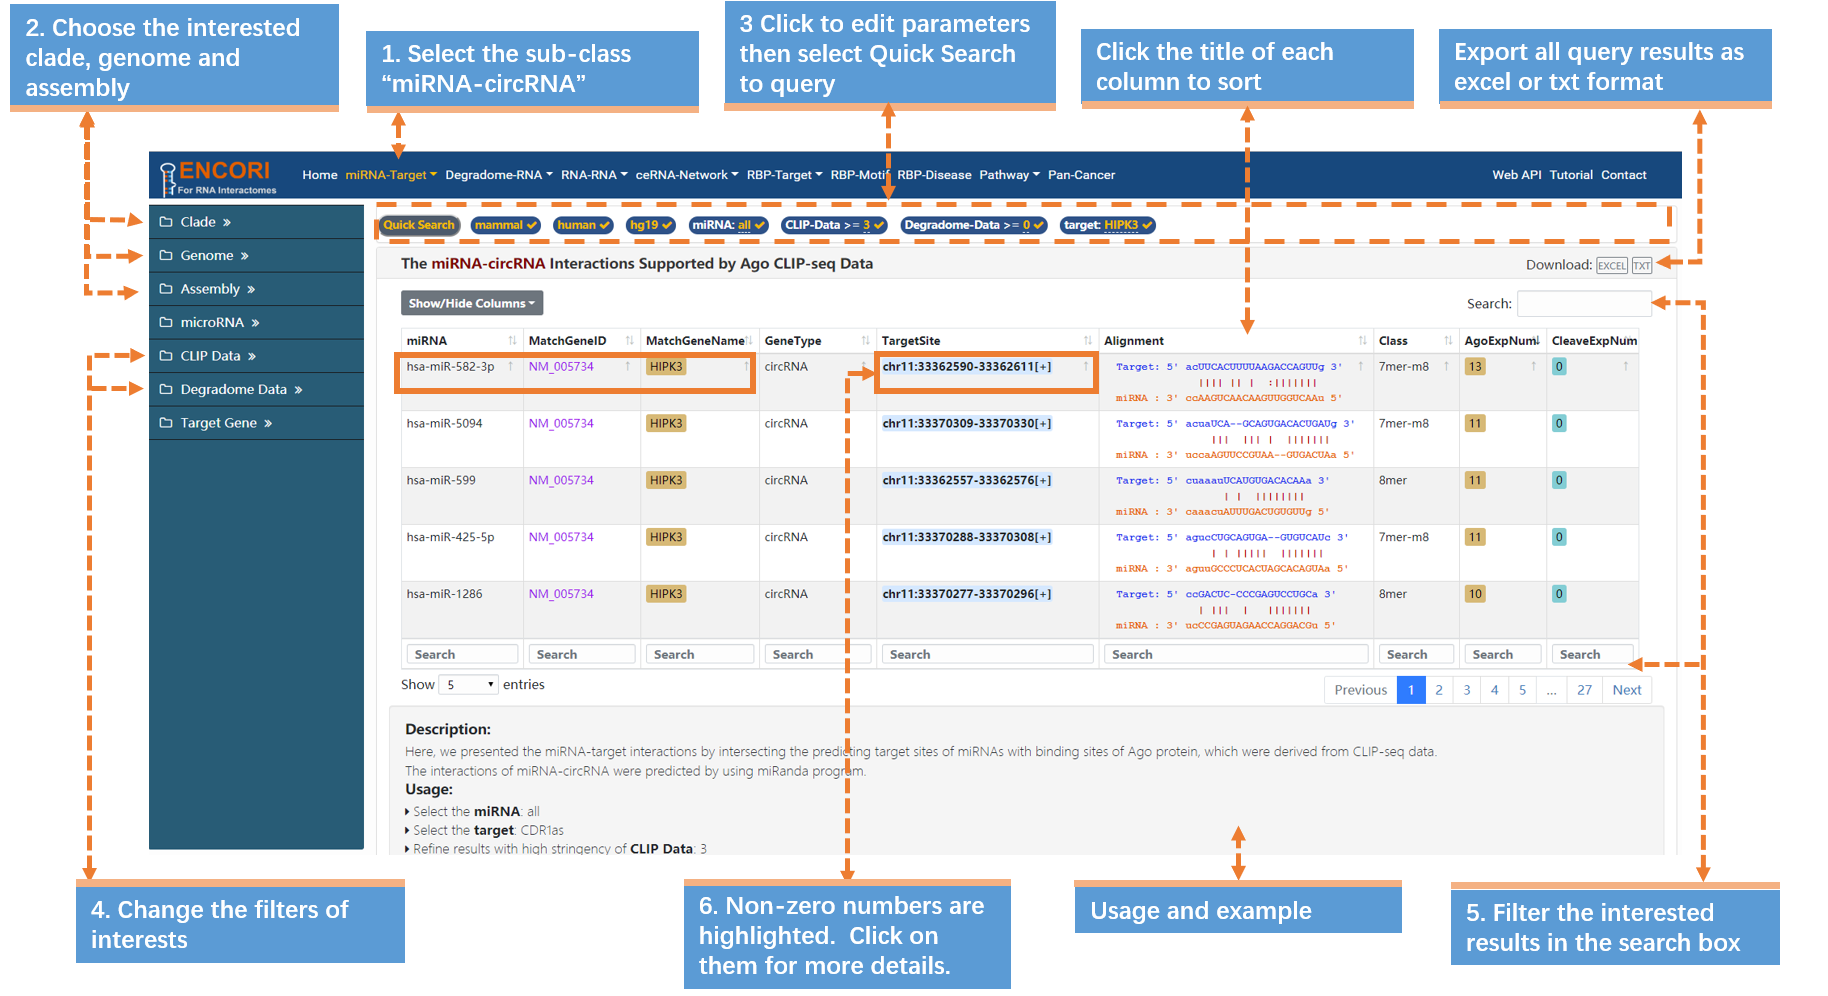
Fig.1-3 The miRNA-"HIPK3" interactions supported by degradome-seq data
| Column | Explanation |
|---|---|
| MatchGeneID | Click to link to circBase database. |
| MatchGeneName | Click to browse binding region on circRNAs. |
| TargetSite | Select to link to UCSC Genome Browser. |
Table.1-3 Explanation of columns in the results table
2. Degradome-RNA
The "Degradome-RNA" module provides a comprehensive means of analyzing patterns of RNA degradation and has 2 sub-modules, including miRNA-mRNA and miRNA-ncRNA. Here, we give two examples to show how to use the module to explore the cleavage-mediated miRNA-mRNA and miRNA-ncRNA interactions supported by degradome-seq experiments.
2-1 Which mRNAs are natural targets of miR-196-directed cleavage?
A microRNA usually can exert post-transcriptional control over a broad set of cellular mRNAs. Here, we take "miR-196" (in human) that has been reported to interact with HOXB8 as an example to explore miRNA-mRNA interactions (Fig.2-1a):
1. Choose the miRNA-mRNA sub-module under "Degradome-RNA" module.
2. In the sidebar:
a) Select the genome with left sidebar features: clade (mammal), genome (human), assembly (hg19).
b) Click "miRNA" parameter and input "hsa-miR-196a-5p" (official miRNA name) in the opened box.
c) By default, the "target" parameter is "all".
d) Change the filters of interests. Here we use a stringent parameter to refine our results: degradome data (>=3). And we filter out 12 mRNAs. By default, the results are sorted by degradome-seq data number.
3. Click the highlighted non-zero characters to view more details. In the results table, we present cleavage events of hsa-miR-196a-5p on genes supported by degradome-seq data. For example, click 3 in the CleaveExpNum column to browse the cleavage experiments of HOXB8. And the highlighted characters can also be selected (Fig.2-1b). You can access more information about the unmentioned parameters (Table.2-1).
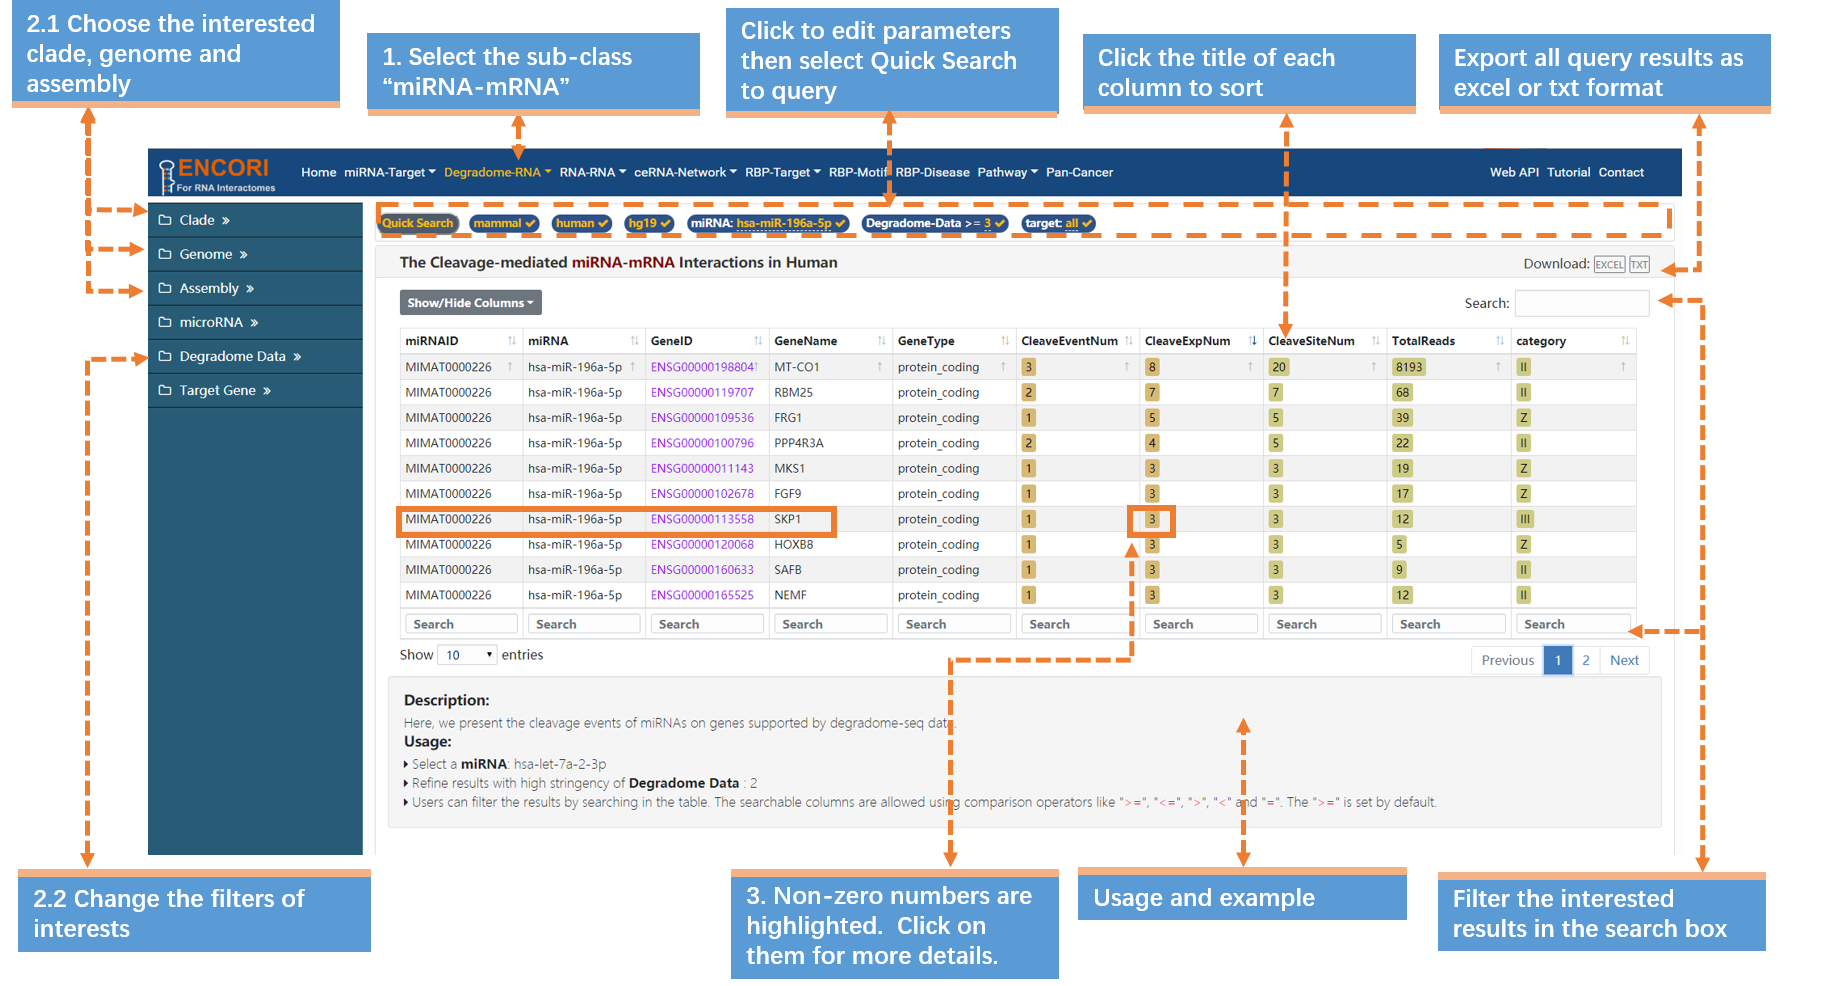
Fig.2-1a The cleavage-mediated "hsa-miR-196a-5p"-mRNA interactions in Human
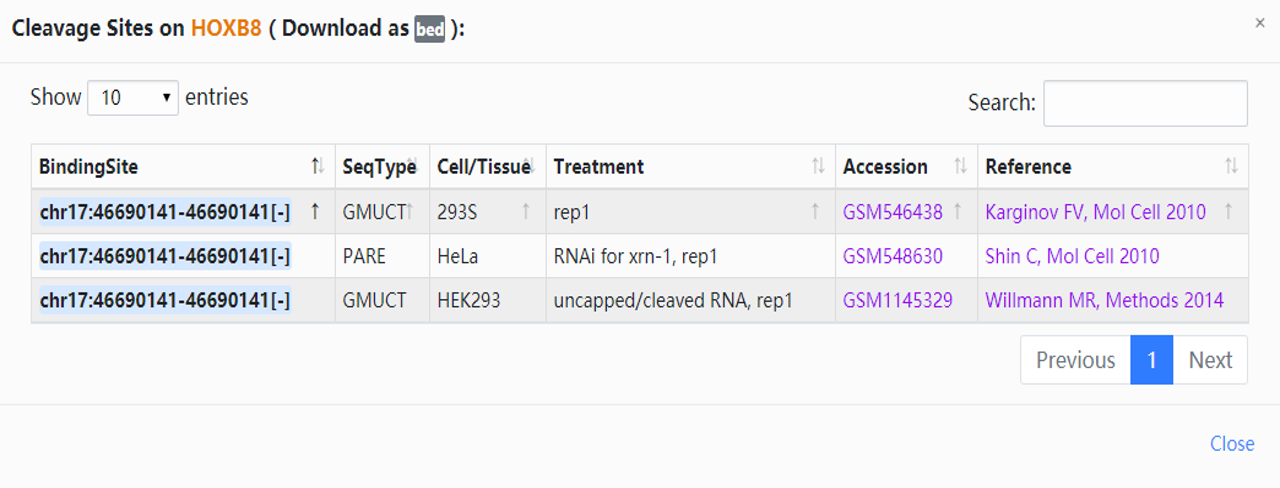
Fig.2-1b The cleavage sites on HOXB8 in Human
| Column | Explanation |
|---|---|
| CleaveEventNum | Number of cleavage events. Click to browse get more details about microRNA cleavage sites. |
| CleaveSiteNum | Number of supporting cleavage sites from degradome-seq experiments. |
| TotalReads | Total reads from all samples. |
| Category | Defined by starscan program. |
| CleaveSite | In the table shown after you select a character of CleaveEventNum column. Click to link to ENSEML database. |
| BindingSite | In the table shown after you select a character of CleaveExpNum column. Click to link to ENSEML database. |
Table.2-1 Explanation of columns in the results table
2-2 How many miRNAs may mediate the degradation of MYB33 gene?
In plants, miRNAs usually cause targeted gene scilencing by directing the cleavage of targets. Here, we take "MYB33" (in A. thaliana) as an example to study cleavage-mediated miRNA-mRNA interactions (Fig.2-2a):
1. Choose the miRNA-mRNA sub-module under "Degradome-RNA" module.
2. Select the genome with left sidebar features: clade (eudicots), genome (A. thaliana), assembly (TAIR10).
3. In the "Quick Search" under the navigation bar:
a) Click "miRNA" parameter and input "all" in the opened box.
b) Click "target" parameter and input "MYB33" (official gene symbol) in the box.
c) Click "Quick Search" button to submit the query.
4. Change the filters of interests in the sidebar. Here we use a stringent parameter to refine our results: degradome data (>=3). And we filter out 6 miRNAs. By default, the results are sorted by degradome-seq data number.
5. Click the highlighted non-zero characters to view more details. In the results table, we present cleavage events of miRNAs on MYB33 supported by degradome-seq data (Fig.2-2a). For example, click 2 in the CleaveEventNum column, you can get more details about the cleavage site of ath-miR159a on MYB33, and you can click the highlighted characters in this chart (Fig.2-2b).

Fig.2-2a The cleavage-mediated miRNA-"MYB33" interactions in A. thaliana
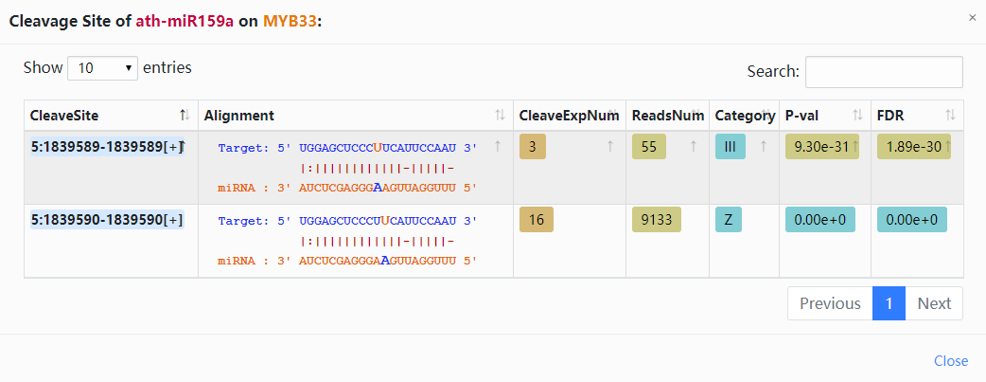
Fig.2-2b The cleavage-mediated miRNA-"MYB33" interactions in A. thaliana
3. RNA-RNA
The "RNA-RNA" module provides the comprehensive prediction of RNA–RNA interactions (RRI) between candidate ncRNAs and their targets to understand the role of the RNA. And there are 4 sub-modules, including mRNA-RNA, lncRNA-RNA, pseudogene-RNA, sncRNA-RNA. Here, we give an example to show how to use the module to explore the lncRNA-RNA interactions identified from high-throughput sequencing data of RNA-RNA interactome.
3-1 How many RNAs could H19 interact with?
lncRNAs have well established functions and much remains to be done towards decipherment of their biological roles. One of the least studied aspects of lncRNAs biology is their engagement in gene expression regulation through RNA-RNA interactions. We instance H19 thath has been reported to interact with DICER to explore lncRNA-RNA interaction network (Fig.3-1a).
1. Choose the lncRNA-RNA sub-module under "RNA-RNA" module.
2. In the left sidebar:
a) Select the genome: clade (mammal), genome (human), assembly (hg19).
b) Click "Gene" parameter and input "H19" (official gene symbol) in the opened box.
c) Change the filters of interests. Here we use a series of parameters to refine our results: Interactions (>=1) and Experiments (>=1). By default, the results are sorted by RNA-RNA interactome data number.
3. Click the highlighted non-zero characters to browse more details. In the results table, we present lncRNA-H19 interaction network supported by RNA-RNA interactome experiments (Fig.3-1a). For example, click 1 in the Interactions column, you can get more details about the DICER-H19 interactions, and the highlighted characters in this chart can also be selected to view detailed information (Fig.3-1b). More explanation of parameters in the results table can bee accessed (Table.3-1).
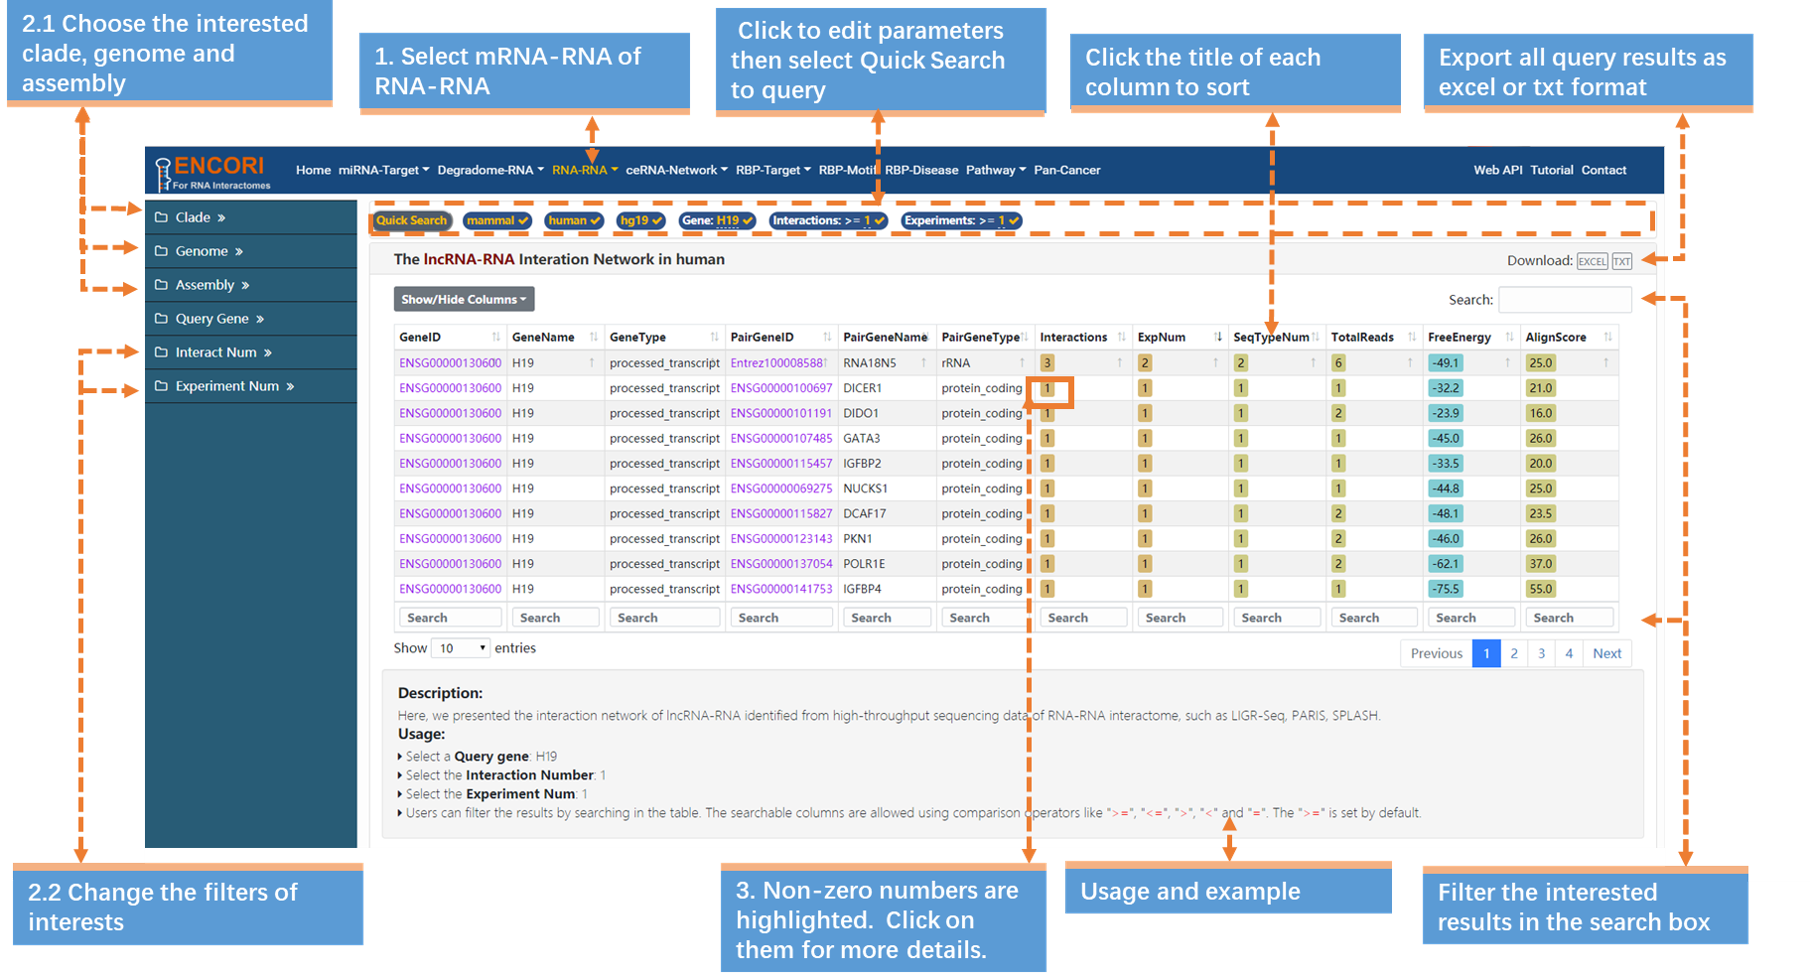
Fig.3-1a The lncRNA-H19 interaction network in human
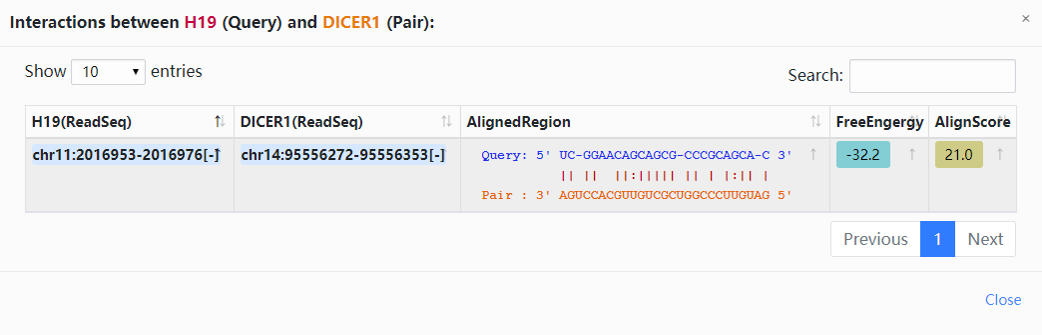
Fig.3-1b The interactions between H19(Query) and DICER(Pair) in Human
| Column | Explanation |
|---|---|
| PairGeneID | Click to link to ENSEMBL database. |
| Interactions | Number of RNA-RNA interactions. Select to browse RNA-RNA interactions. |
| ExpNum | Number of Experiments. Click to browse detailed information about supporting experiments. |
| FreeEnergy | The minimum free energy of RNA-RNA pairs were calculated by RNAfold software. |
| AlignScore | Calculated by Smith-Waterman algorithm. The analysis results with alignment score greater than 10 were kept and stored in ENCORI. |
Table.3-1 Explanation of columns in the results table
4. ceRNA-Network
The "ceRNA-Network" module provides 3 sub-modules, including mRNA-ceRNA, lncRNA-ceRNA and pseudogene-ceRNA, which are used to visualize the crosstalk between mRNAs, lncRNAs, transcribed pseudogenes and their parent genes by competitive binding of microRNAs respectively. Here, we use an example to introduce how to use the module to study the mRNA-ceRNA interactions supported by CLIP-seq data.
4-1 What are the ceRNA interaction networks of PTEN?
Crosstalk between RNAs mediated by shared miRNAs represents a novel layer of gene regulation, which plays important roles in cellular scenarios. Study the PTEN-centered (in human) ceRNA networks as an example to explore the module (Fig.4-1).
1. Choose the mRNA-ceRNA sub-module under "ceRNA-Network" module.
2. In the left sidebar:
a) Select the genome: clade (mammal), genome (human), assembly (hg19).
b) Click "ceRNA Gene" parameter and input "PTEN" (official gene symbol) in the opened box.
c) Change the filters of interests. Here we use a set of stringent parameters to refine our results: miRNA Number (>=2), P-value (<=1.0e-6), FDR (<=1.0e-6) and Pan-Cancer (10 cancer types). By default, the results are sorted by CLIP-seq data number.
3. Filter the interested results in the search box. Input ">=68" in the search box of HitMiRNum column. Then click the title of the column to resort results.
4. Click the highlighted non-zero characters to browse more details. In the results table, we present ceRNA interaction network of PTEN supported by CLIP-seq data (Fig.4-1). For example, click 68 in the Interactions column to get more details about the DICER-H19 interactions. You can view the explanation of the unmentioned columns (Table.4-1).
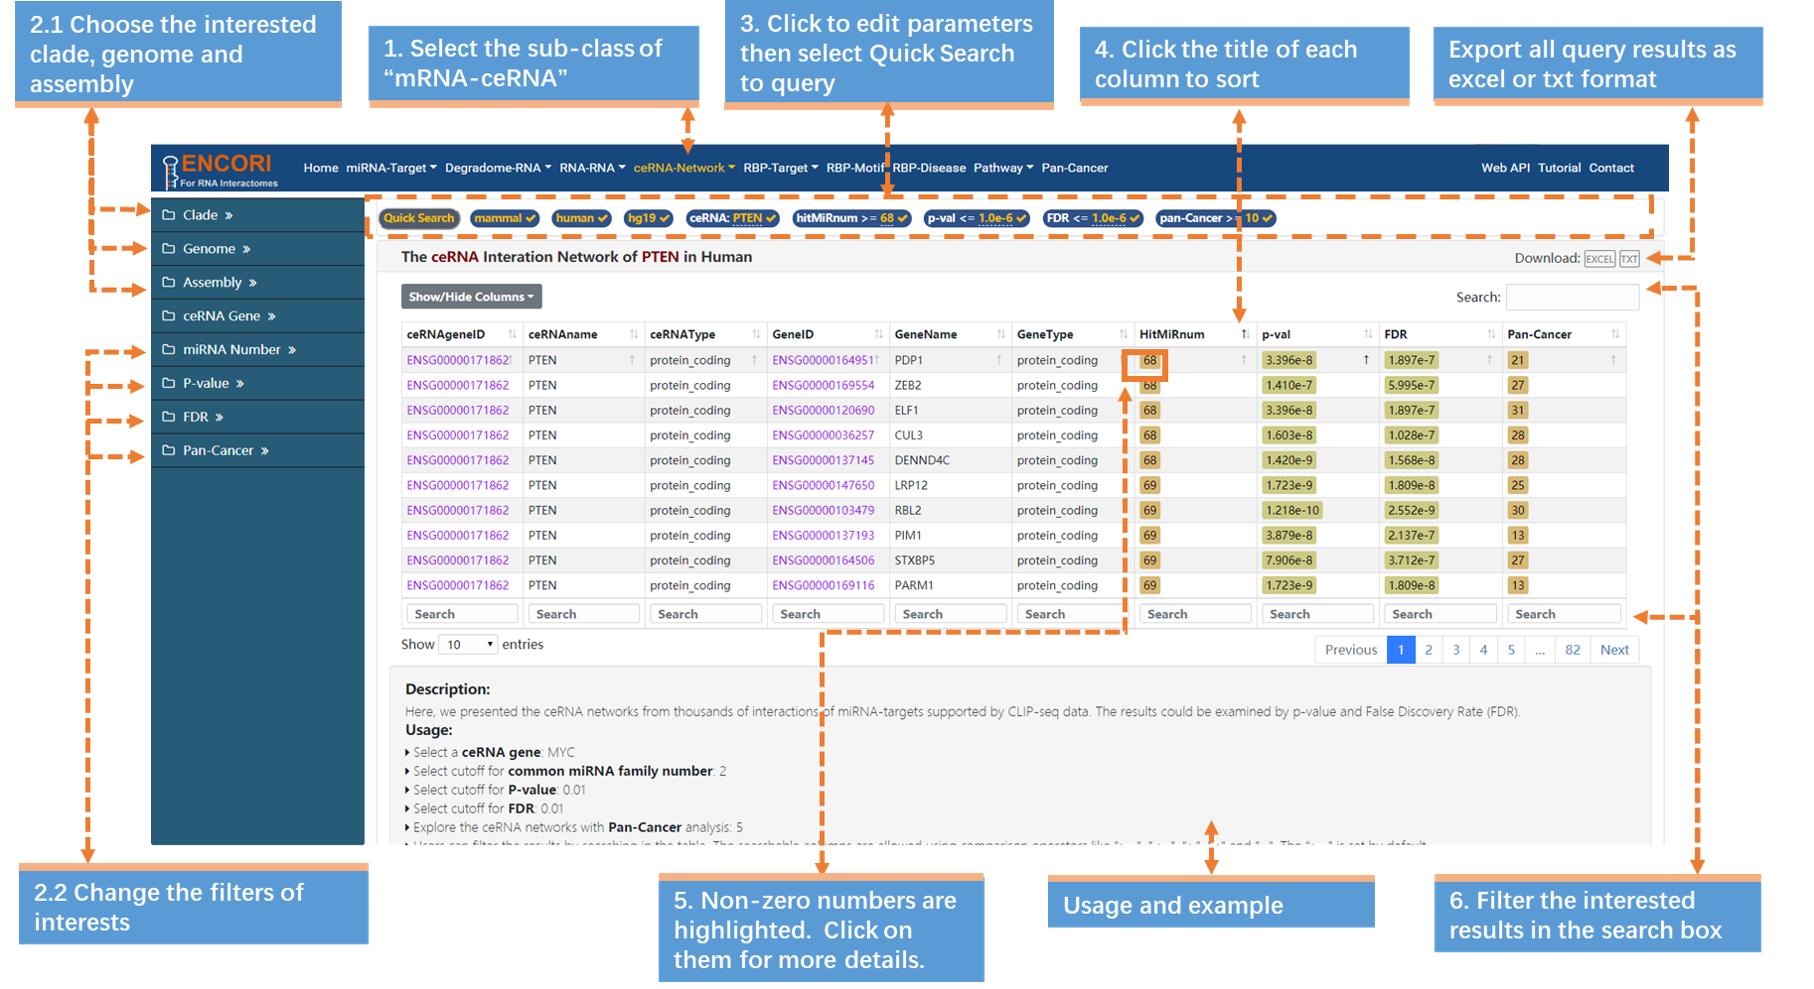
Fig.4-1 The ceRNA interaction network of PTEN in human
| Column | Explanation |
|---|---|
| ceRNAGeneID | Click to link to ENSEMBL database. |
| HitMiRNum | Select to browse hit miRNA families. |
Table.4-1 Explanation of columns in the results table
5. RBP-Target
The "RBP-Target" module provides the most integrated RBP-ncRNA interactions for various cell types that are presently available. There are 5 sub-modules in this module, including RBP-mRNA, RBP-lncRNA, RBP-pseudogene, RBP-circRNA as well as RBP-sncRNA. Accompanied with shRNA screen data and convinced interactions of RBP-RNA, we systematically explored the response of RBP targets upon RBP-knockdown conditions in K562 and HepG2 cell lines. As an example, we study RBP-mRNA interactions to explore the RBP-Target module.
5-1 How many RBPs could regulate TP53?
RBPs are crucial functional components of the molecular machineries involved in posttranscriptional events, such as premRNA splicing, mRNA editing. We navigate the reported CBX7-TP53 (in human) interactions as an example (Fig.5-1a):
1. Choose the RBP-mRNA sub-module under "RBP-Target" module.
2. Select the genome with left sidebar features: clade (mammal), genome (human), assembly (hg19).
3. In the "Quick Search" under the navigation bar:
a) Click "RBP" parameter and input "all" (official gene symbol) in the opened box.
b) Click "target" parameter and input "TP53" (official gene symbol) in the opened box.
c) Click "Quick Search" button to submit the query.
4. Change the filters of interests in the sidebar. Here we use a set of stringent parameters to refine our results: CLIP data (>=1) and pan-Cancer (10 cancer types). By default, the results are sorted by CLIP-seq data number.
5. Select the title of the column to resort results. Here we click the title "ClipExpNum".
6. Click the highlighted non-zero characters to browse more details. We present ceRNA interaction network of PTEN supported by CLIP-seq data (Fig.5-1a). For example, click 1 in the ClusterNum column, you can view more details about the cluster sites of CBX7 on TP53. In this chart the highlighted characters can also be selected to view more information (Fig.5-1b). Explanation of parameters in the results table can be viewed (Table.5-1).

Fig.5-1a The RBP-TP53 interactions in human

Fig.5-1b The binding site of CBX7 on TP53 in human
| Column | Explanation |
|---|---|
| ClusterNum | The number of stacked peak regions. Click to view cluster sites. |
| ClipExpNum | The number of CLIP-seq experiments. Select to browse binding sites. |
| ClipSiteNum | The number of supporting binding sites from CLIP-seq experiments. |
| HepG2 (log2FC) | The change (log2FC) of gene while knocking down RBP in HepG2 cell lines. |
| K562 (log2FC) | The change (log2FC) of gene while knocking down RBP in K562 cell lines. |
Table.5-1 Explanation of columns in the results table
6. RBP-Motif
The "RBP-Motif" module provides insight into the function and evolution of both RBPs and their binding sites. We present a systematic analysis of the RNA motifs recognized by RNA-binding proteins. Here, we study RBP-mRNA interactions as an example to illustrate the RBP-Motif module.
6-1 What are the motifs of IGF2BP2?
RBPs are crucial functional components of the molecular machineries involved in posttranscriptional events, such as premRNA splicing, mRNA editing. Sequence-specific associations between RBPs and their RNA targets are typically regulated by one or more motifs, however, few of them have been studied in detail. We identify the motifs of IGF2BP2 (in human) as an example (Fig.6-1):
1. Choose the RBP-Motif module.
2. In the sidebar:
a) Select the genome : clade (mammal), genome (human), assembly (hg19).
b) Click "RBP" parameter and input "IGF2BP2" (official gene symbol) in the opened box.
c) Click "Cell/Tissue" parameter and choose "HEK293" in the opened box.
d) Click "Property" parameter and choose "PAR-CLIP, repeat 5, doxycycline induced, 4-thiouridine, RNase T1" in the opened box.
3. Download the data of interests. For example, click Download button in the Region column, and you will download a compressed file "SBDH35-motif2.bed.gz" which contains detailed information about the UGGAC motif. More information about the columns in the results table can be accessed (Table.6-1).
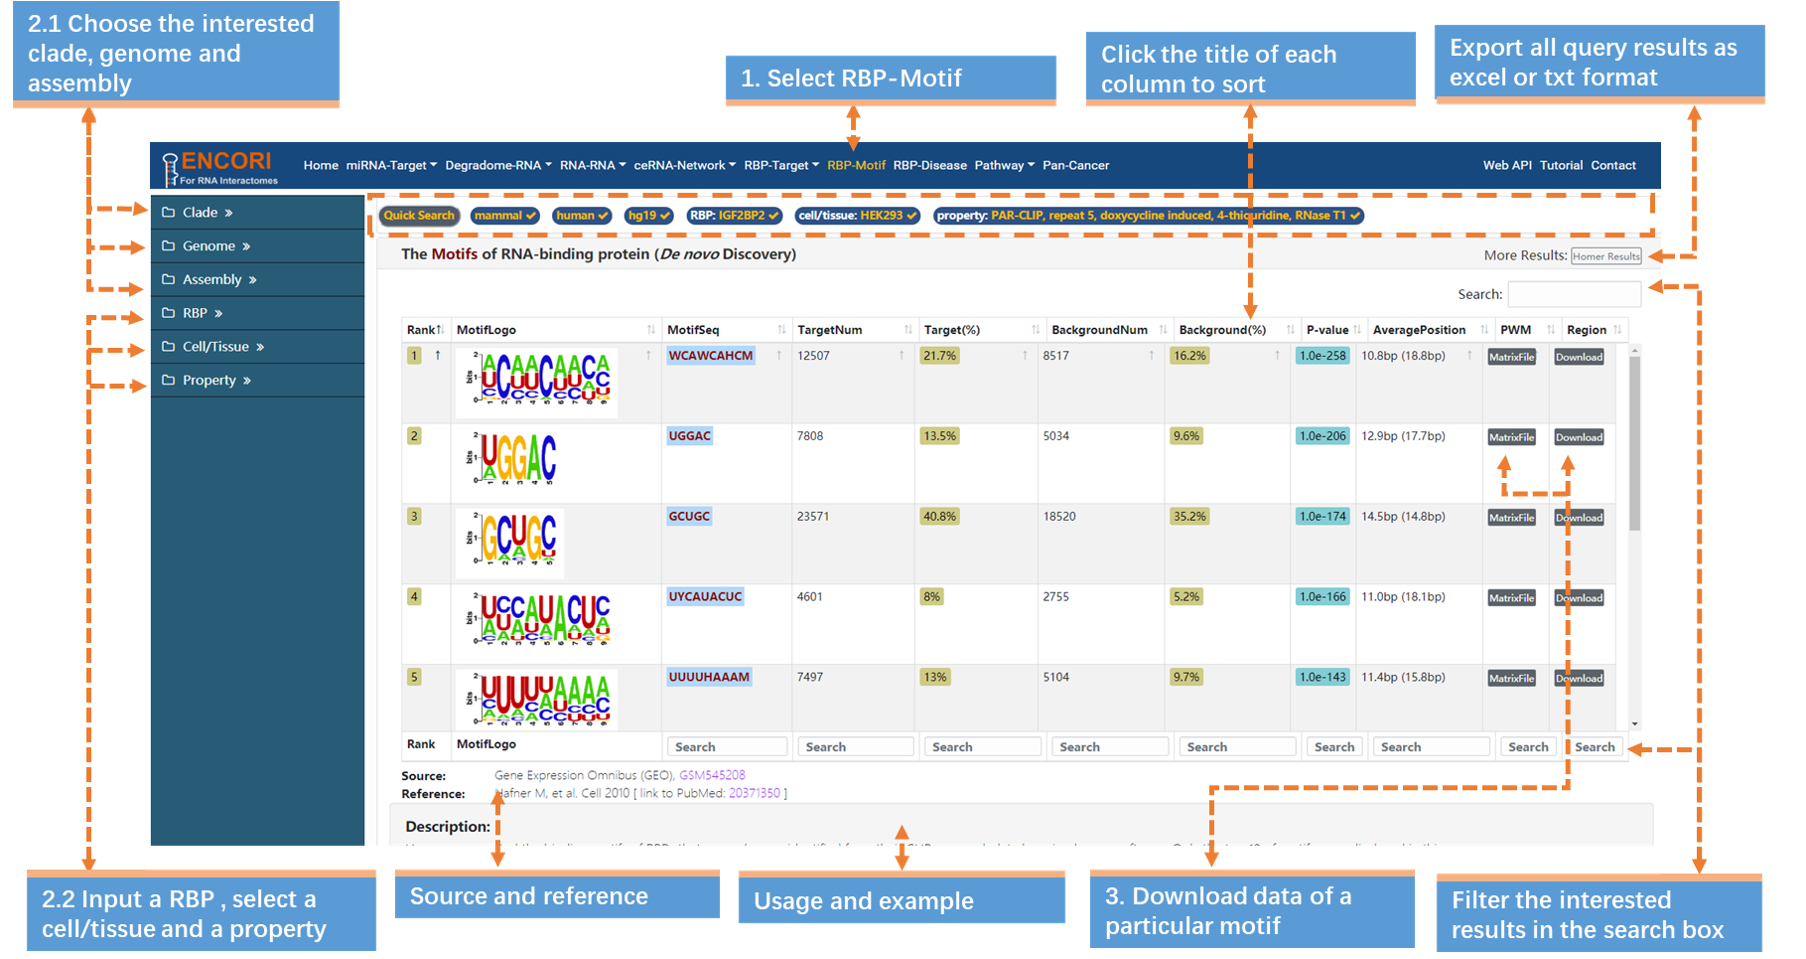
Fig.6-1 The motifs (de novo identification) of IGF2BP2 in human
| Column | Explanation |
|---|---|
| TargetNum | Number of peaks that contain motif. |
| Target (%) | Percentage of peaks that contain motif in all peaks. |
| AveragePosition | Average position of motif in targets (backgrounds). |
| PWM | Click to download the position weight matrix file of motif. |
| Region | Click to download the genomic coordinates of motif (in bed format). |
Table.6-1 Explanation of columns in the results table
7. RBP-Disease
The "RBP-Disease" module provides visualization of the relationships between RBP and somatic gene mutations in 44 tissues and 366 diseases. Here is an example using the module to explain the potential connections between RBP-RNA interactions and its related diseases.
7-1 How are the correlations between RBP-BRCA1 interactions and somatic mutations?
RBPs are a class of post-transcriptional regulatory molecules which are increasingly documented to accumulate functionally impactful mutations in cancer genomes. However, our current understanding of their relationships with somatic mutations is limited. Using the RBP-Disease module, we can explore the deeper connections between RBP-BRCA1 interactions and somatic mutations in human diseases. Take the reported DHX9-BRCA1 interactions as an example (Fig.7-1a).
1. Choose the RBP-disease module.
2. Select the genome with left sidebar features: clade (mammal), genome (human), assembly (hg19).
3. In the "Quick Search" under the navigation bar:
a) Click "RBP" parameter and input "all" in the opened box.
b) Click "target" parameter and input "BRCA1" (official gene symbol) in the opened box.
c) Click "Quick Search" button to submit the query.
4. Change the filters of interests in the sidebar:
a) Select "Tissue" parameter and input "breast".
b) Select "Disease" parameter and input "carcinoma".
5. Click the highlighted non-zero characters to browse more details. We present the interactions between RBP-BRCA1 and human diseases (Fig.7-1a). For example, click 5 in "DiseaseNum" column to access more linked diseases information. In this chart the highlighted characters can also be selected to view more information (Fig.7-1b).
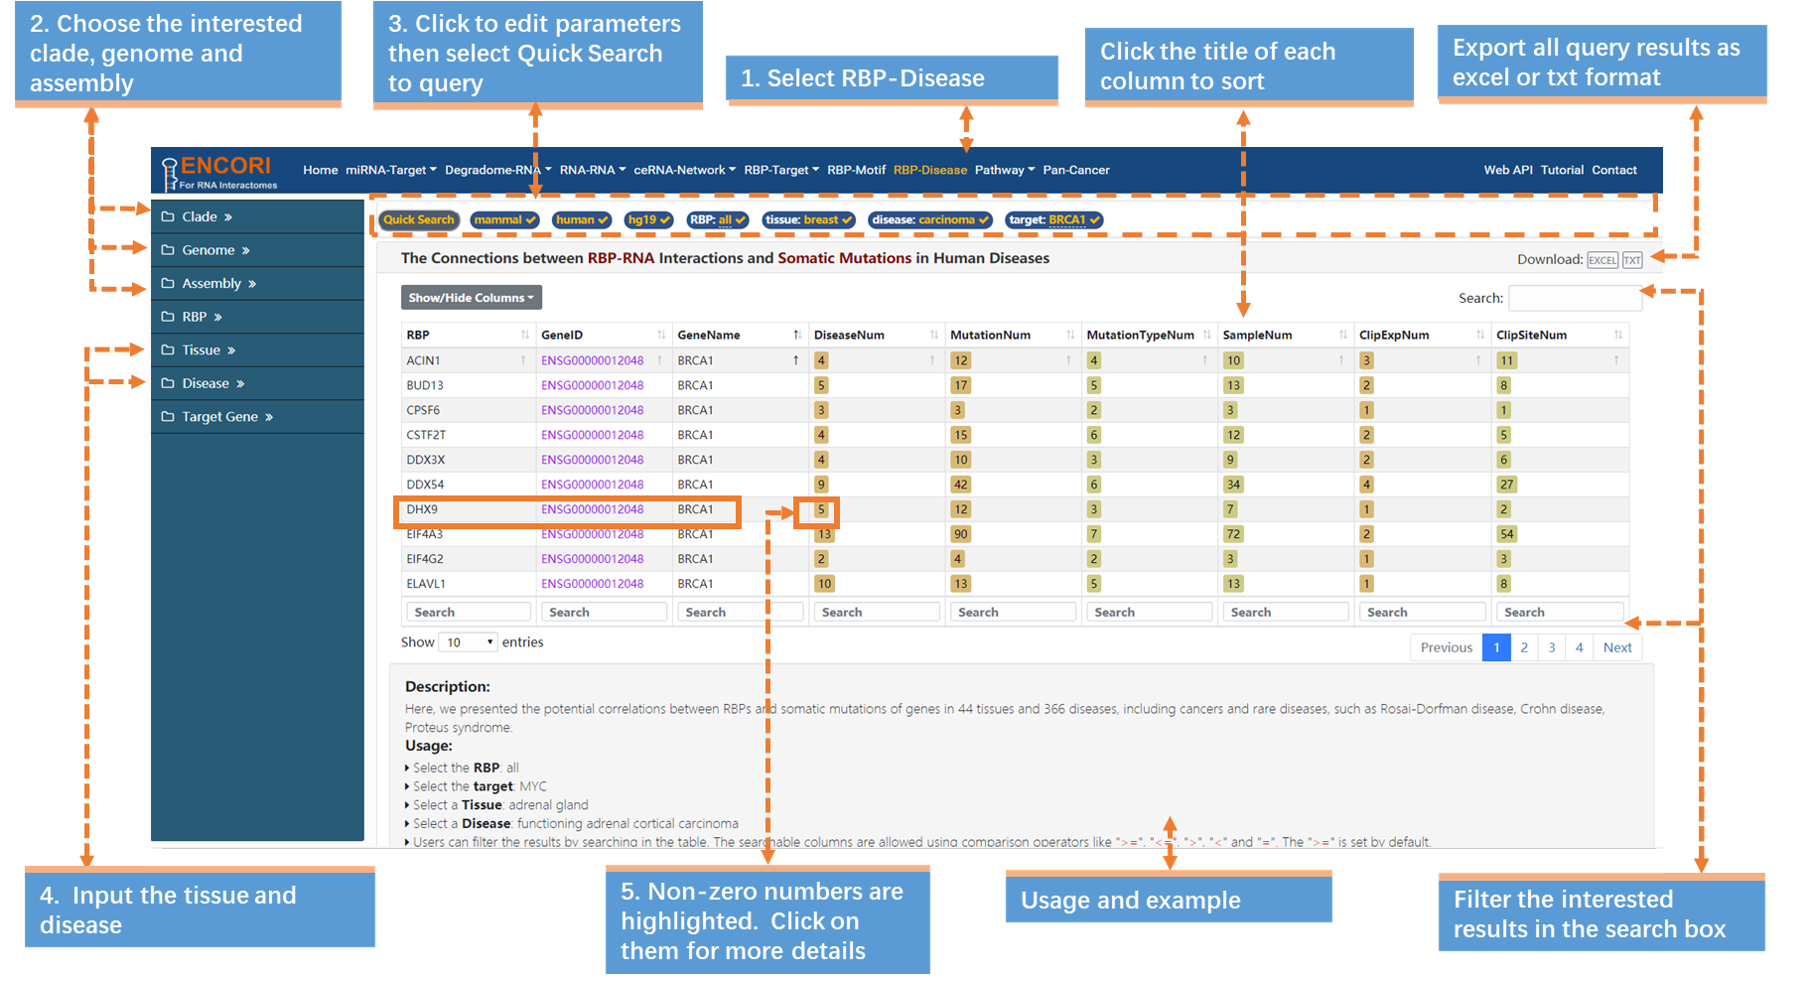
Fig.7-1a The connections between RBP-BRCA1 interactions and somatic mutations
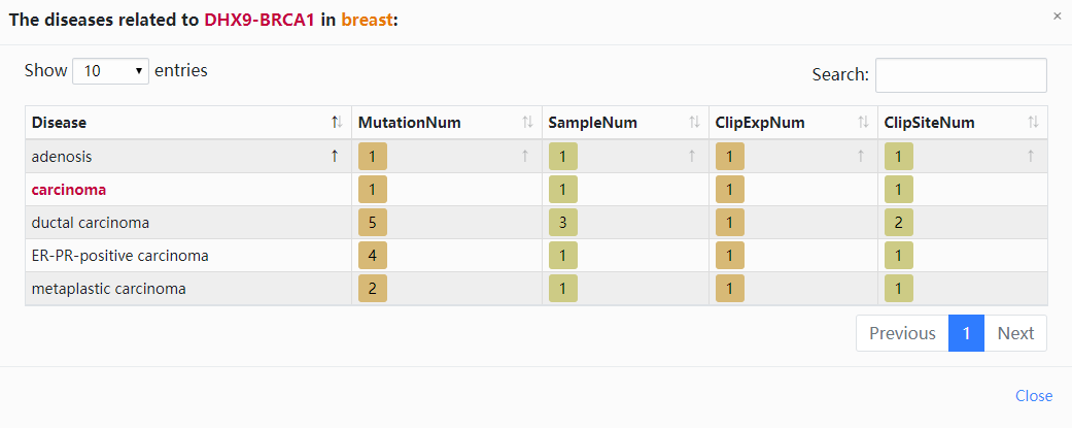
Fig.7-1b The diseases related DHX9-BRCA1 in breast
8. Pathway
The "Pathway" module provides the interactions of miRNA-targets by intersecting the predicting target sites of miRNAs with binding sites of Ago protein, which were derived from CLIP-seq data. There are 4 sub-modules, including mirTarPathway, rbpTarPathway, rnaTarPathway, ceRnaPathway. To study the interactions of miRNA and targets, we give the following example.
8-1 What are the potential biological roles of hsa-let-7a-5p?
RBPs has diverse cellular post-transcriptional regulatory functions. Pathway analysis of RBPs can reveal their potential biological roles. We do the enrichment analysis of hsa-let-7a-5p in KEGG pathways (Fig.8-1).
1. Choose the mirTarPathway sub-module under "Pathway" module.
2. In the left sidebar:
a) Select the genome with left sidebar features: clade (mammal), genome (human), assembly (hg19).
b) Click "miRNA" parameter and input "hsa-let-7a-5p" (official miRNA symbol) in the opened box.
c) Click the "pathway" parameter and choose "KEGG Pathways".
d) Change the filters of interests. Here we use a series of stringent parameters to refine our results: CLIP-seq experiments (>=5), degradome-seq data (>=0), Pan-Cancer (>=0), program number (>=5) and predicted program (none). By default, the results are sorted by CLIP-seq data number.
3. Browse more details. Click the highlighted characters of pathway (pathwayName) to link the GSEA website. For example, click "KEGG_P53_Signaling_Pathway" in the pathwayName column to view more details (Fig.8).
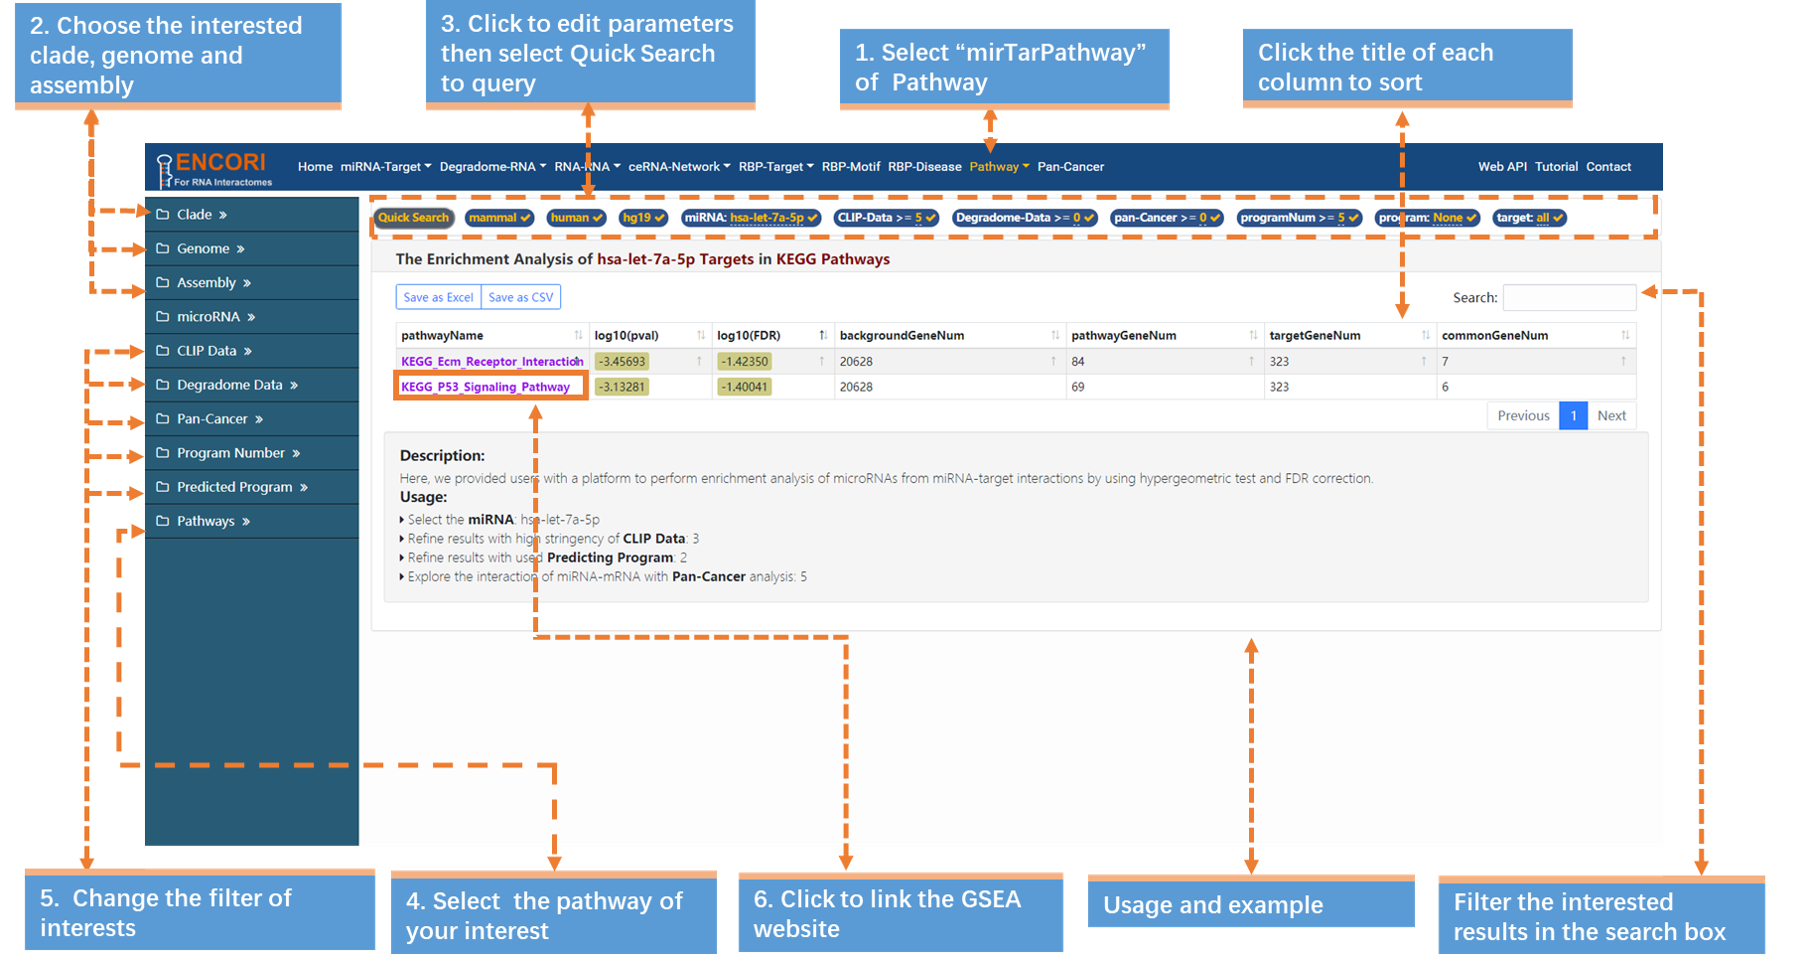
Fig.8-1 The enrichment analysis of hsa-let-7a-5p in KEGG pathways
9. Pan-Cancer
The "Pan-Cancer" module provides comprehensive Pan-Cancer Networks of lncRNAs, miRNAs, pseudogenes, snoRNAs and RNA-binding proteins (RBPs) by analyzing their expression profiles across 32 cancer types ( ~9900 miRNA-seq and ~10,000 samples) integrated from TCGA project via Genomic Data Commons Data Portal. There are 6 cancer-related services, including miRNA Differential Expression, miRNA survival Analysis, miRNA-Target CoExpression, Gene Differential Expression, Gene Survival Analysis and RNA-RNA CoExpression. Here, we introduce the Pan-Cancer analysis platform with 4 examples to explore the Pan-Cancer network of miRNA-lncRNA, miRNA-pseudogene, miRNA-sncRNA and miRNA-mRNA interactions.
9-1 What is the expression pattern of miR-34a in cancer?
An increasing number of studies have identified miRNAs as potential biomarkers for human cancer diagnosis, prognosis and therapeutic targets or tools, which needs further investigation and validation. MiRNAs may function as either oncogenes or tumor suppressors under certain conditions. Take "miR-34a" as an example (Fig.9-1a~b).
1. Choose the Pan-Cancer module (Fig.9-1a).
2. Select miRNA Differential Expression in the entrance of the platform (Fig.9-1a).
3. Input miRNA "hsa-mir-34a-5p / MIMAT0000062" (official miRNA symbol or ID) (Fig.9-1b).
4. Select the cancer type "Colon Adenocarcinoma" (Fig.9-1b).
5. Browse more details. Click a single point in the boxplot to view more expression details (Fig.9-1b).
6. Export the figure, click the button in the top-right of the scatter plot and select "Download PNG image" (Fig.9-1b).
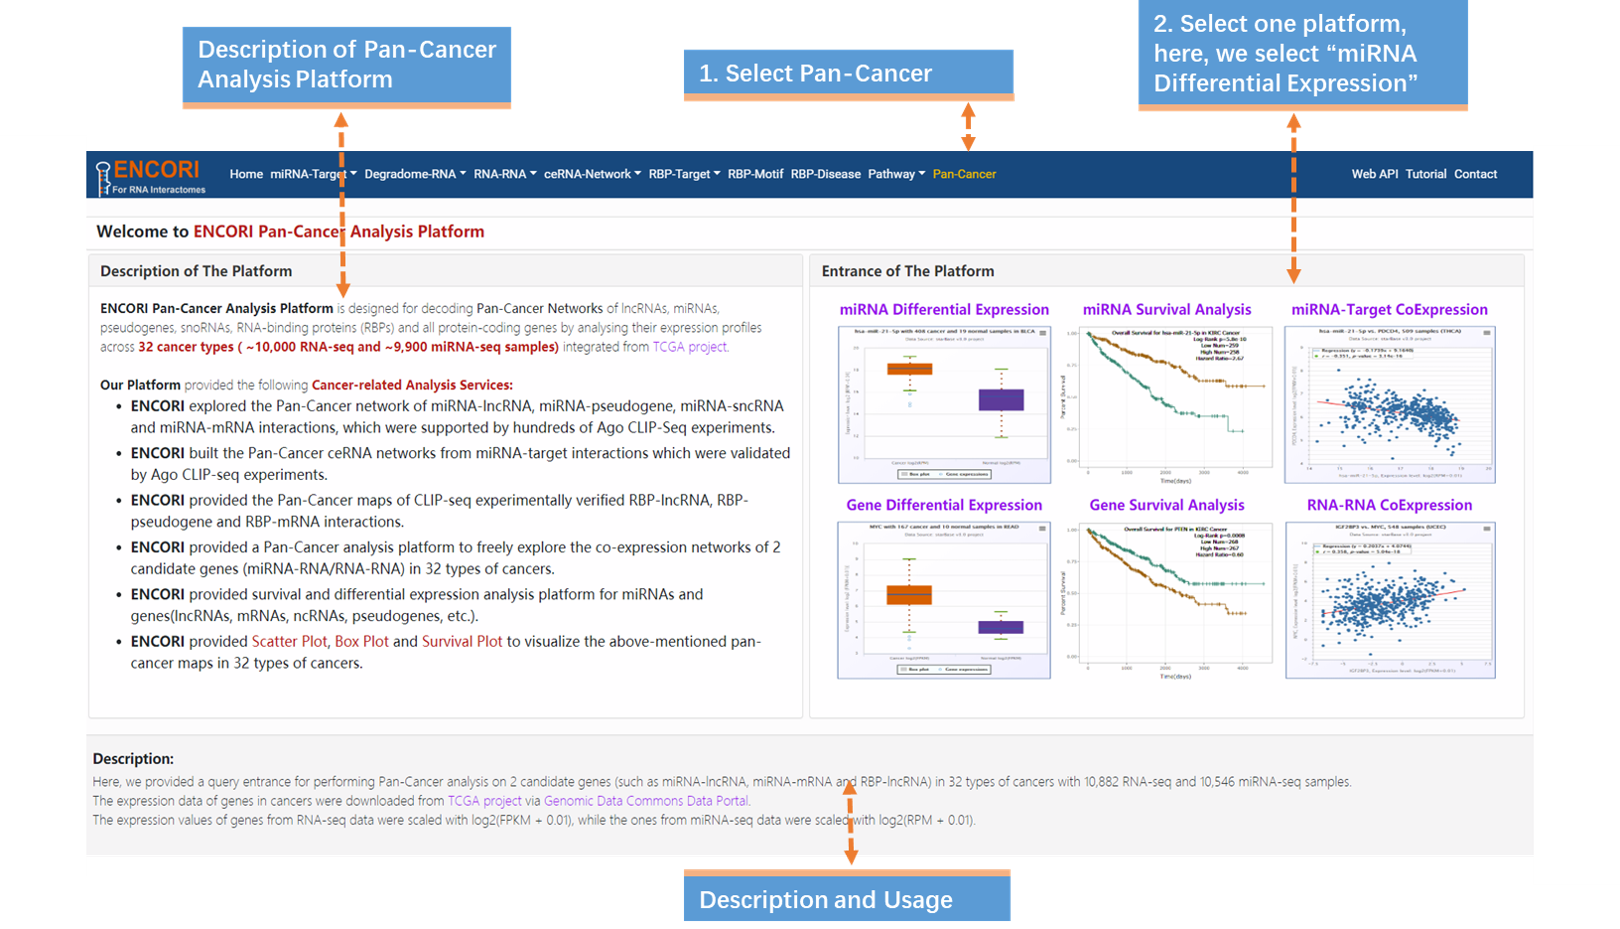
Fig.9-1a Pan-Cancer Differential Expression Analysis of "hsa-miR-34a-5p" across 32 types of Cancers (Query Page)
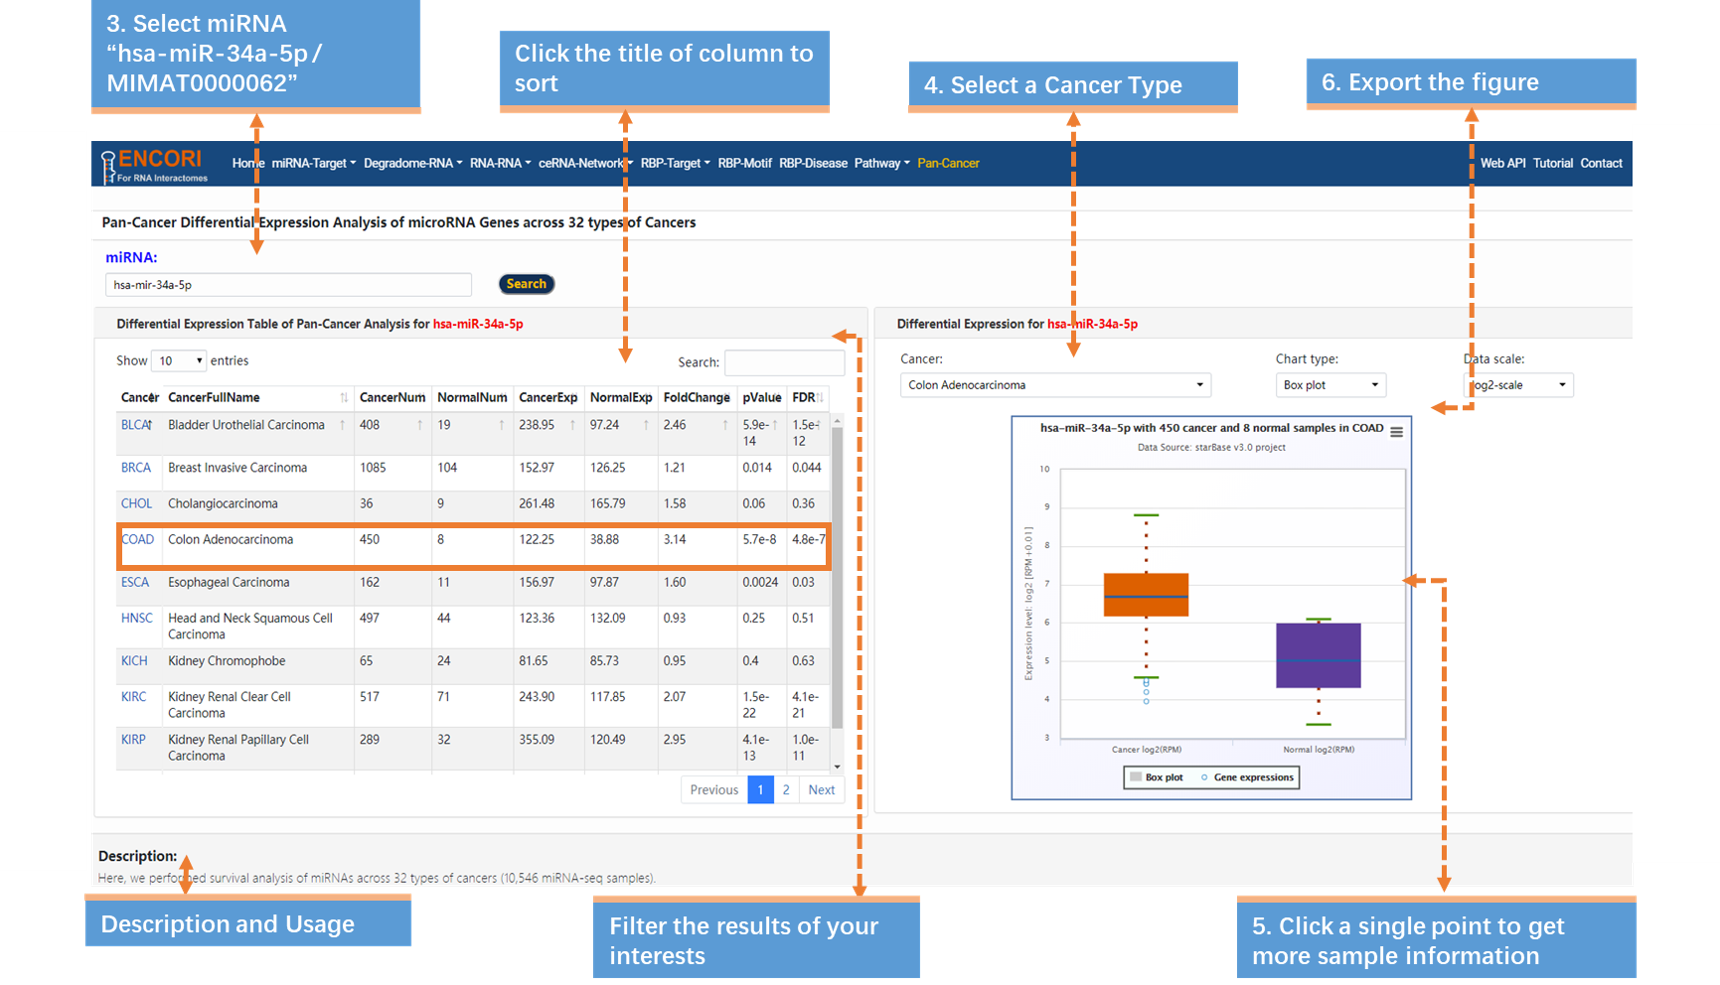
Fig.9-1b Pan-Cancer Differential Expression Analysis of "hsa-miR-34a-5p" across 32 types of Cancers (Result Page)
9-2 What is the relationship between hsa-mir-21-5p and PDCD4 in colorectal cancer?
Abnormalities in non-coding genes, including miRNAs, can determine biological alterations in tumor cells to execute the invasion-metastasis cascade. We seek to investigate the relationship between miR-21 ang PDCD4 in colorectal cancer regulation (Fig.9-2a~b).
1. Choose the Pan-Cancer module (Fig.9-2a).
2. Select miRNA-Target CoExpression in the entrance of the platform (Fig.9-2a).
3. Input miRNA "hsa-mir-21-5p" and Target Gene "PDCD4" (official gene symbol) (Fig.9-2b).
4. Select the cancer type "Colon Adenocarcinoma" (Fig.9-2b).
5. Browse more details (Fig.9-2b).
a) The p-value and r-value of Pearson correlation analysis are in the top-left of the scatter plot.
b) Click a single point to view more expression details about the sample.
6. Export the figure, click the button in the top-right of the scatter plot and select "Download PNG image" (Fig.9-2b).
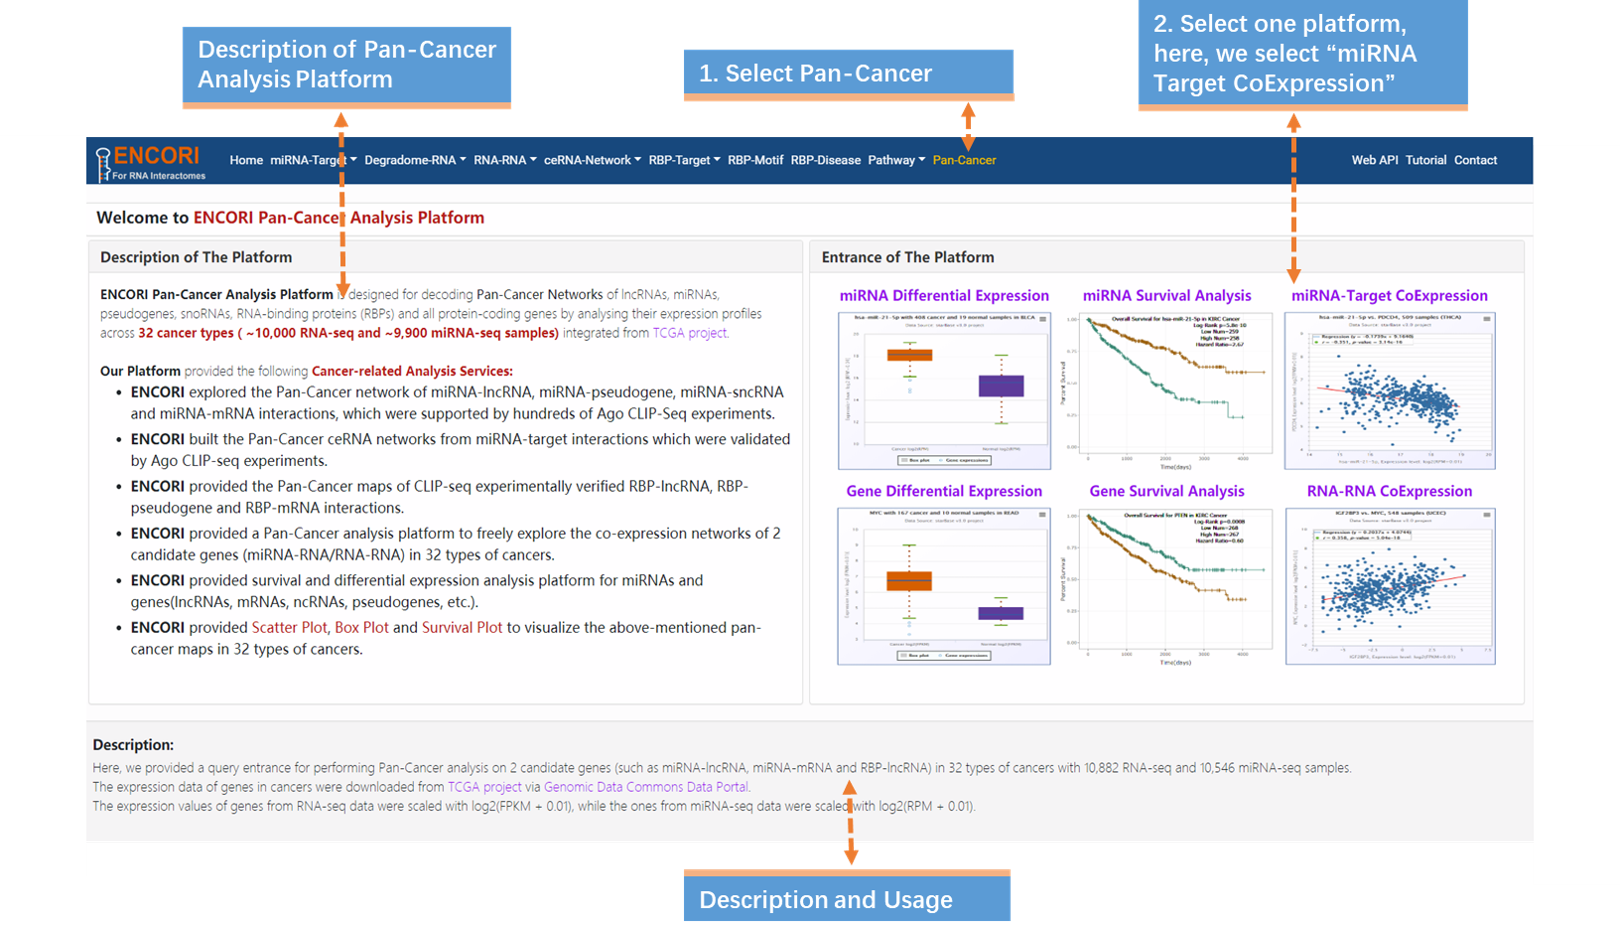
Fig.9-2a The relationship between has-mir-21-5p and PDCD4 in colorectal cancer (Query Page)

Fig.9-2b The relationship between has-mir-21-5p and PDCD4 in colorectal cancer (Result Page)
9-3 What is the association between HOTAIR expression and survival rates in Adrenocortical Carcinoma?
LncRNAs have emerged as primary regulators of carcinogenesis. Thus, lncRNAs may represent the novel prognostic and diagnostic markers of cancer, in addition to being the potential therapeutic targets. Here, we use "Gene Survival Analysis" module to explore overall survival rates in patients with Adrenocortical Carcinoma according to high or low HOTAIR expression levels (Fig.9-3a~b).
1. Choose the Pan-Cancer module (Fig.9-3a).
2. Select Gene Survival Analysis in the entrance of the platform(Fig.9-3a).
3. Input gene "HOTAIR / ENSG00000228630" (official gene symbol or ID) (Fig.9-3b).
4. Select the cancer type "Adrenocortical Carcinoma" (Fig.9-3b).
5. Browse more details (Fig.9-3b).
a) The log-rank p-value, group numbers and hazard ratio are in the top-left of the survival curve.
b) Click a single point to view more expression details.
6. Export the figure, click the button in the top-right of the plot and select "Download plot as a PNG" (Fig.9-3b).
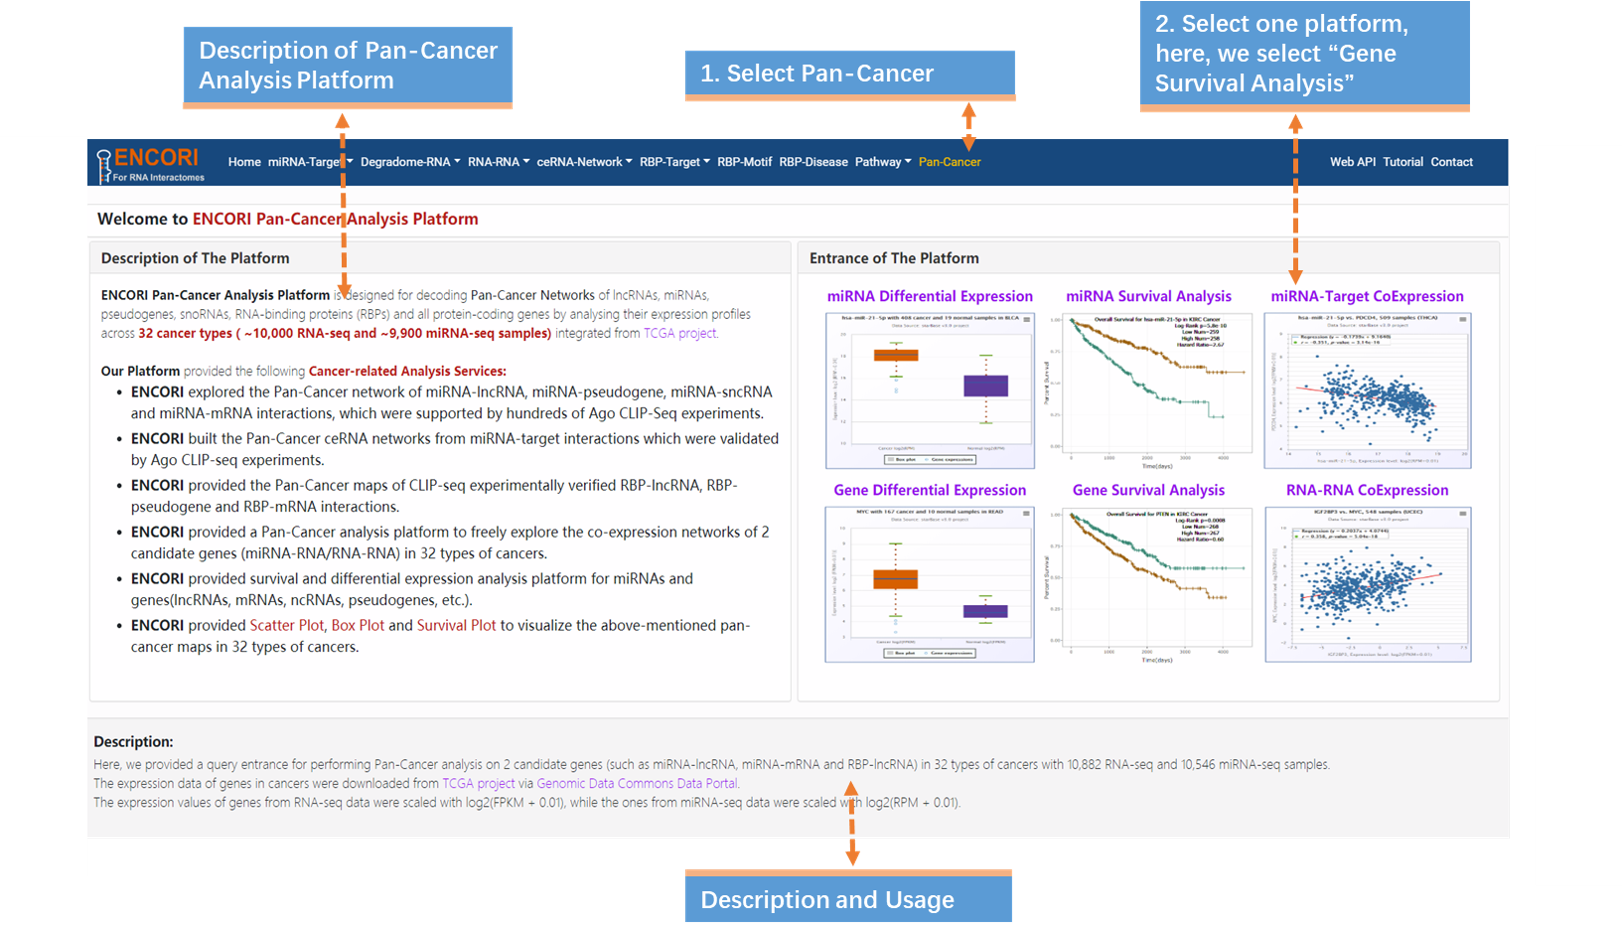
Fig.9-3a Pan-Cancer Survival Analysis of HOTAIR across 32 types of Cancers (Query Page)

Fig.9-3b Pan-Cancer Survival Analysis of HOTAIR across 32 types of Cancers (Result Page)
9-4 What is the correlation between IGF2BP1 and MYC in ovarian cancer?
Intermolecular RNA-RNA interactions are used by many noncoding RNAs (ncRNAs) to achieve their diverse functions. We develop the "RNA-RNA CoExpression" module to systematically analyze RNA-RNA interactions across 32 types of cancers and apply it to explore IGF2BP1 and MYC interactions in ovian cancer (Fig.9-4a~b).
1. Choose the Pan-Cancer module (Fig.9-4a).
2. Select RNA-RNA CoExpression in the entrance of the platform(Fig.9-4a).
3. Input Query Gene "IGF2BP1 / ENSG00000159217" (official gene symbol or gene ID) and Target Gene "MYC / ENSG00000136997" (official gene symbol or gene ID) (Fig.9-4b).
4. Select the cancer type "Ovarian Serous Cystadenocarcinoma" (Fig.9-4b).
5. Browse more details (Fig.9-4b).
a) The p-value and r-value are in the top-left of the scatter plot.
b) Click a single point to view more expression details about the sample.
6. Export the figure, click the button in the top-right of the scatter plot and select "Download PNG image" (Fig.9-4b).
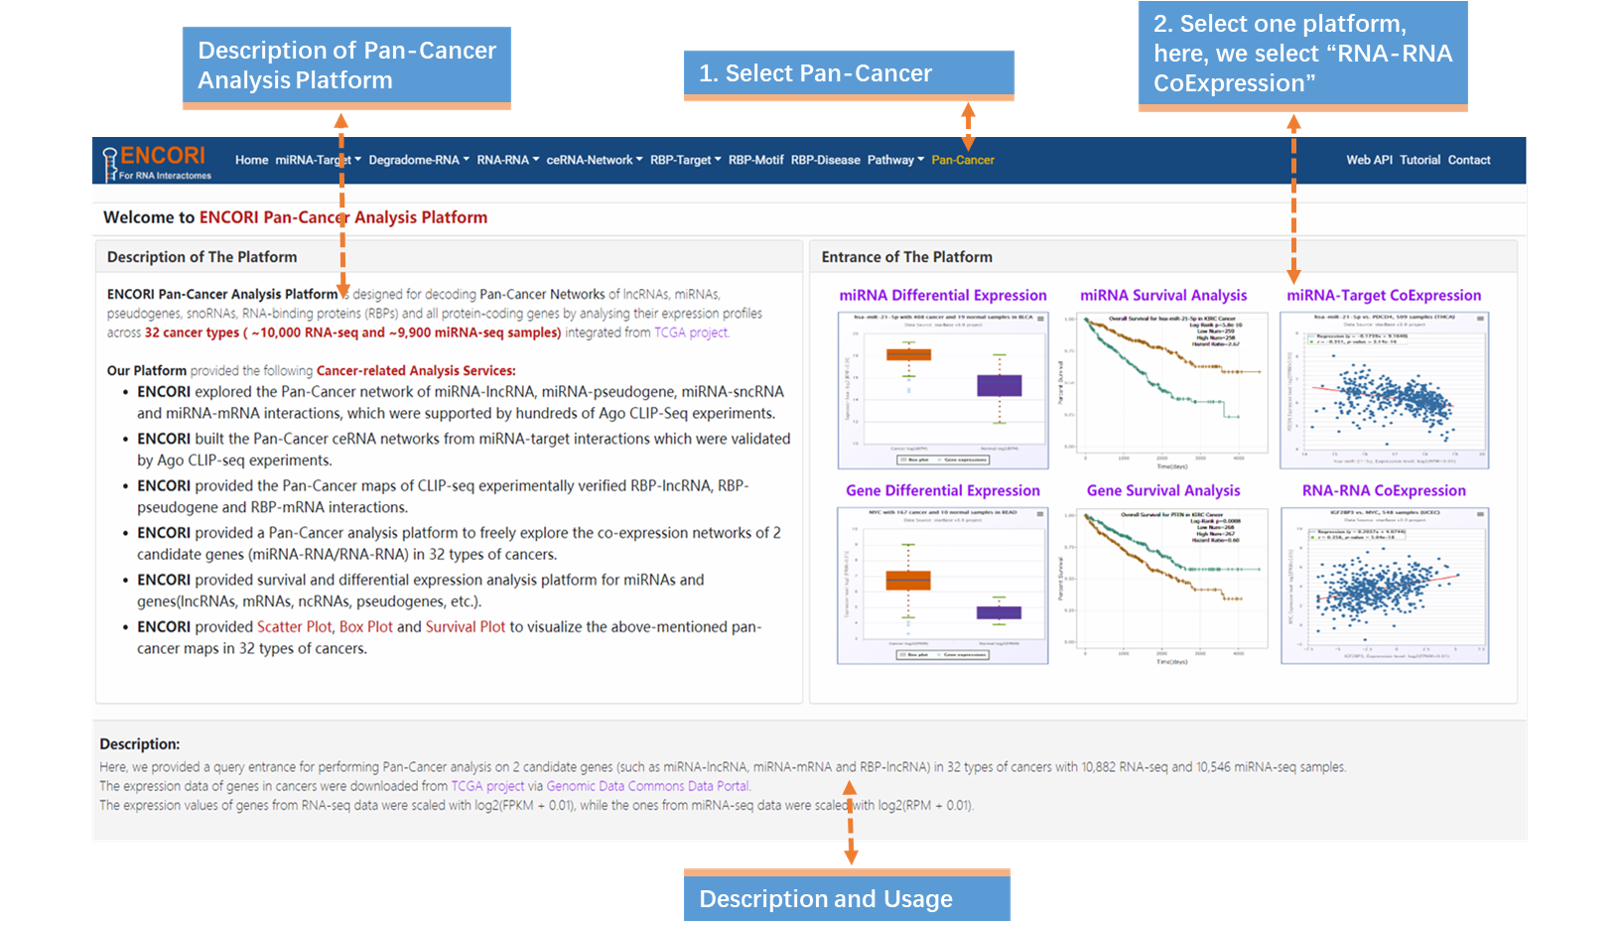
Fig.9-4a The relationship between IGF2BP1 and MYC in ovarian cancer (Query Page)
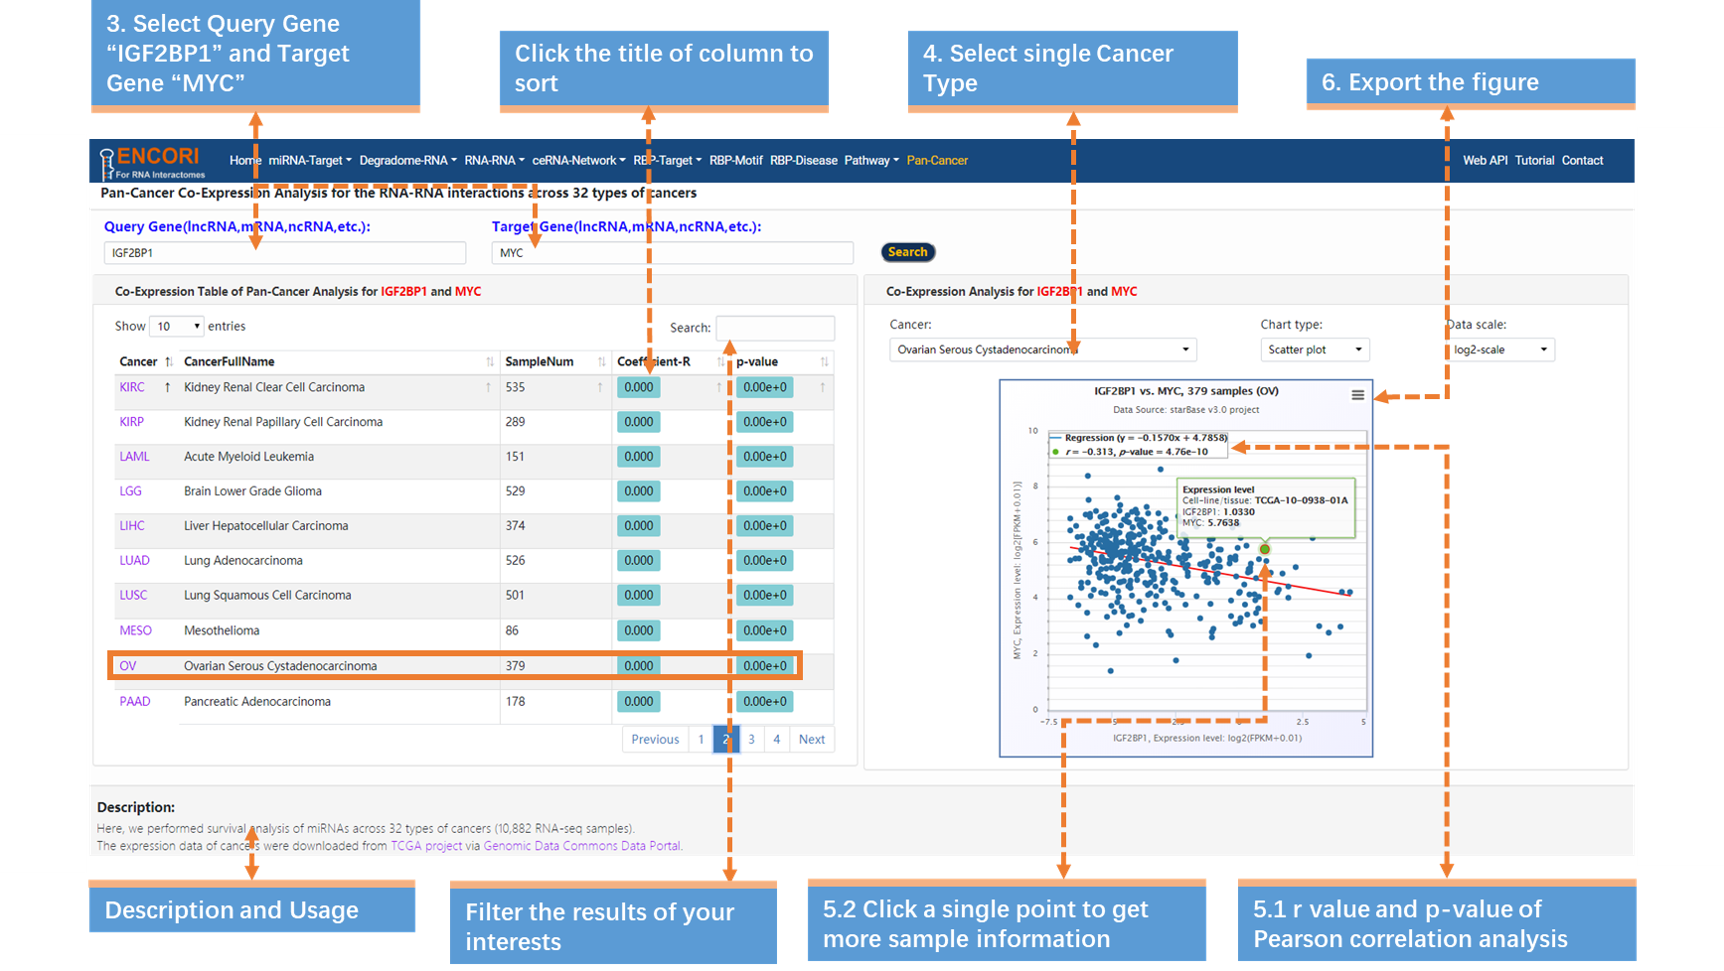
Fig.9-4b The relationship between IGF2BP1 and MYC in ovarian cancer (Result Page)
10. Web API
In the "Web API" module, we provide the direct programmatic access to all regulatory data stored within the server. This enables you to easily access data from your favorite programming language, such as Shell, Python, or Perl.
Here we use curl (command line tool) for communicating with the ENCORI APIs.
Example 1: Get all miRNA data for TP53 (in human).
curl 'http://rna.sysu.edu.cn/encori/api/miRNATarget/?assembly=hg19&geneType=mRNA&miRNA=all&clipExpNum=5°raExpNum=0&pancancerNum=0&programNum=1&program=PITA,RNA22&target=TP53&cellType=HeLa' > ENCORIV3_hg19_CLIP-seq_all_TP53.txt
Example 2: Get all miRNA cleavage data for TP53 (in human).
curl 'http://rna.sysu.edu.cn/encori/api/degradomeRNA/?assembly=hg19&geneType=mRNA&miRNA=all°raExpNum=1&target=TP53&cellType=all' > ENCORIV3_hg19_degradome-seq_all_TP53.txt
You can click "Web API" for more examples.