Search
The Search Module provides comprehensive transcriptional and post-transcriptional regulatory features of pseudogenes from multiple datasets. The usage is desribed as Fig. 1
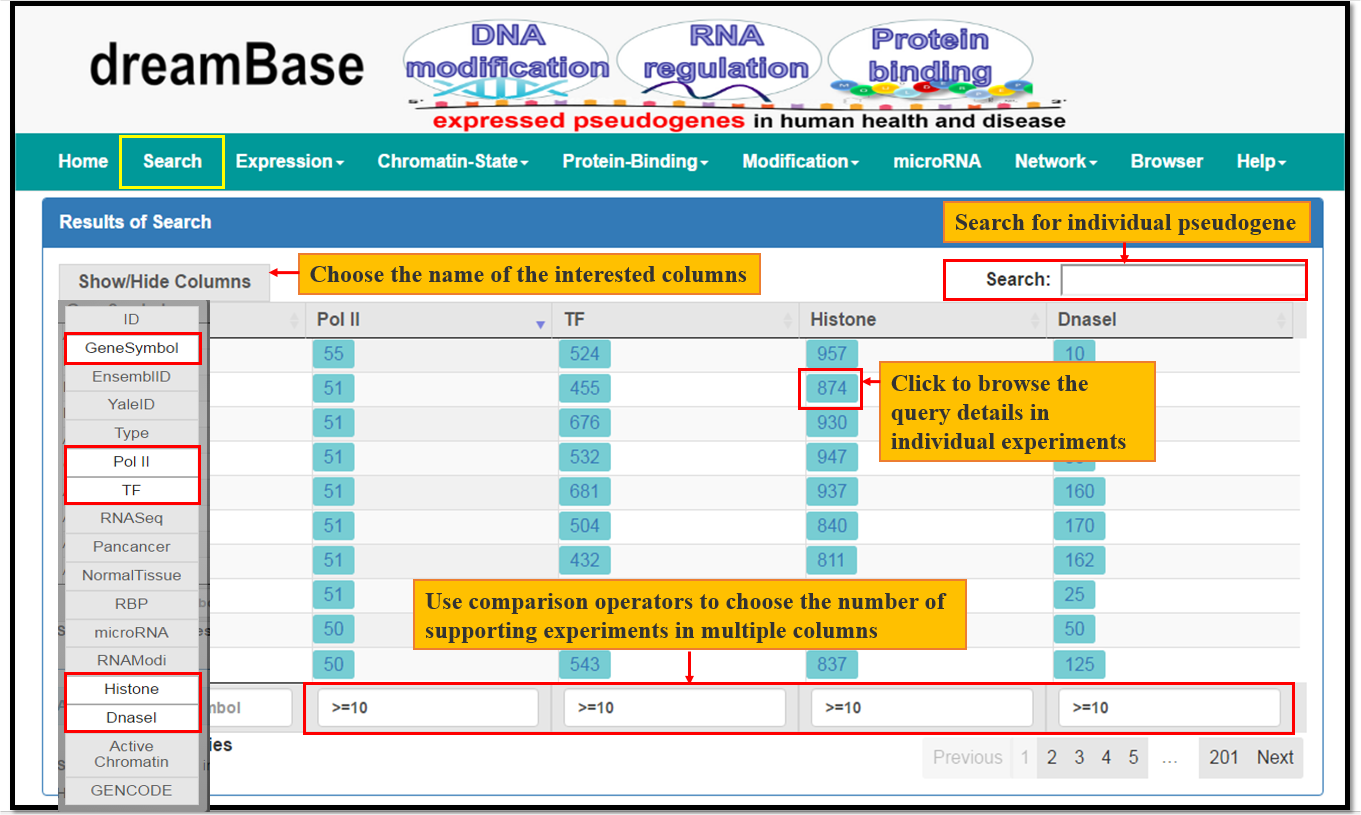
Fig. 1 The Usage of Search Module
Expression
The Expression Module provides expression landscapes of pseudogenes across mutiple types of cancer tissues, cell lines and normal tissues. There are 3 submodules in this module, Pan-Cancer, RNA-Seq and Normal-Tissue. The usage is desribed as Fig. 2 and Fig. 3
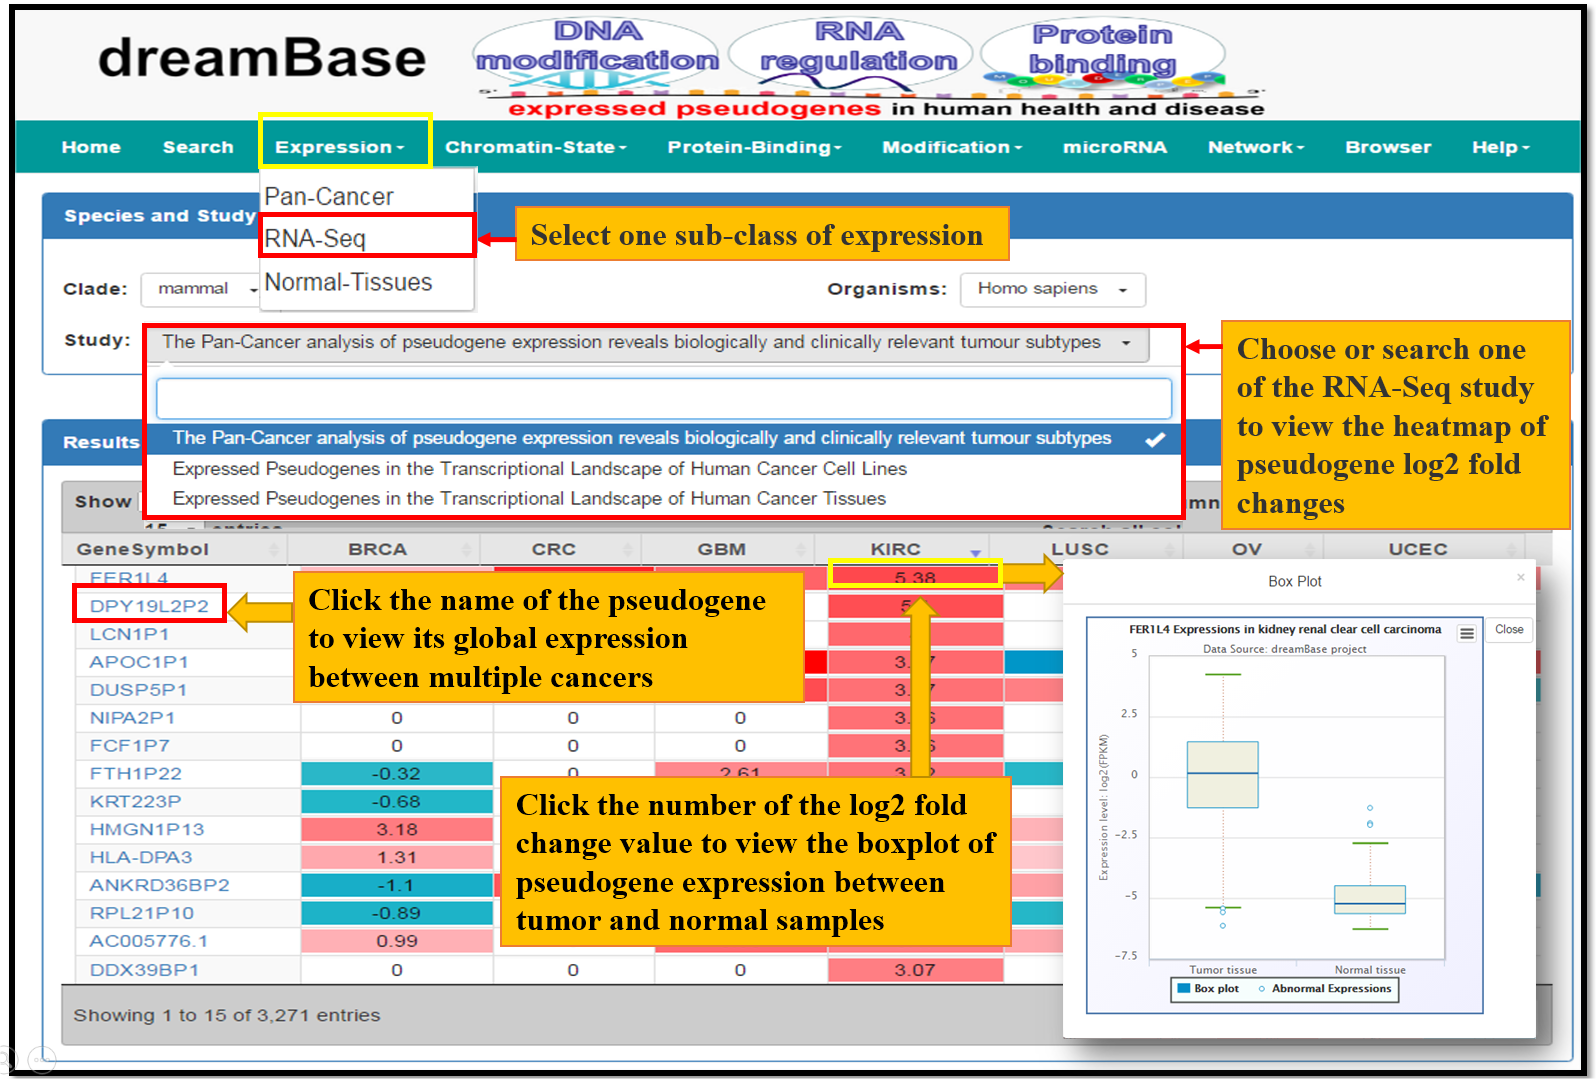
Fig. 2 The Usage of Expression Module
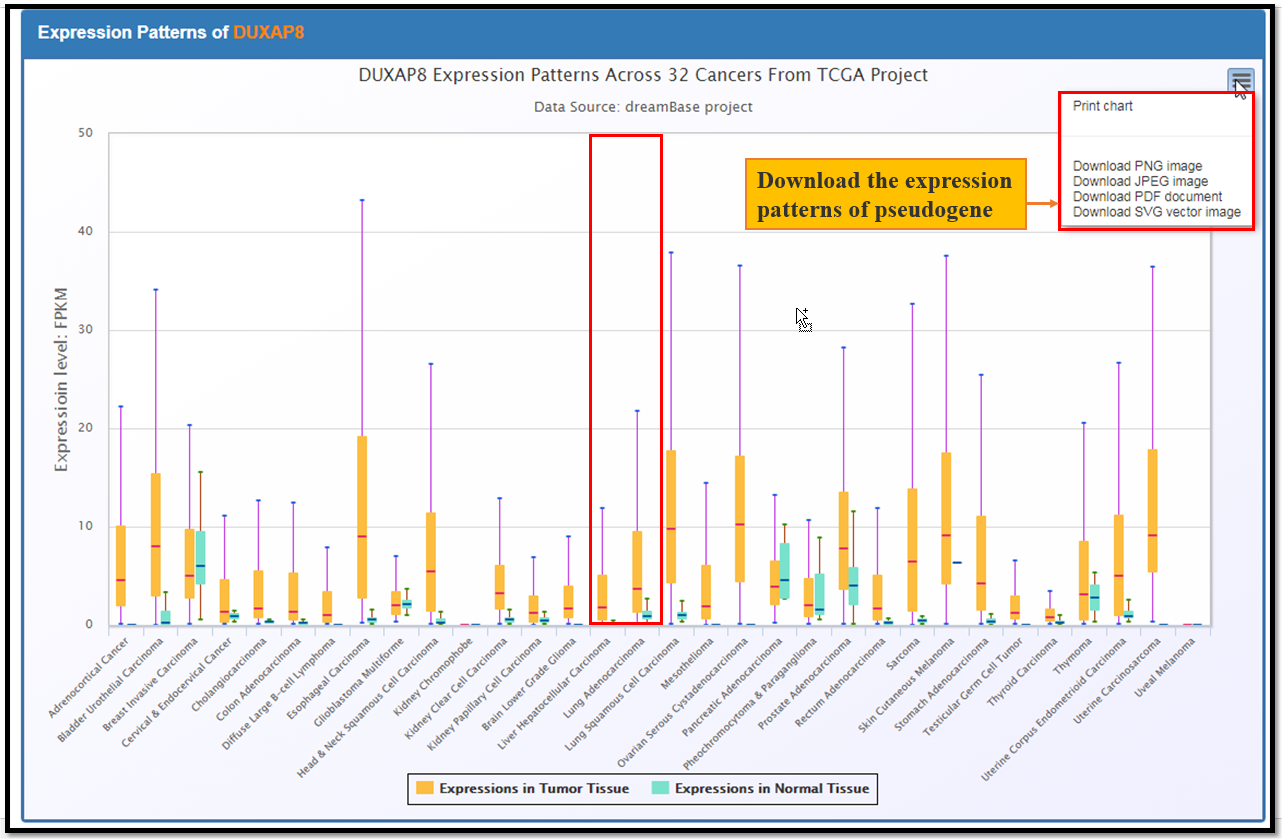
Fig. 3 The Exression Profiles of DUXAP8 Across 32 Cancers
Binding Modules
The Binding Modules provide transcriptional and post-transcriptional regulatory features of pseudogenes, including open chromatin states, signals of active pol II, active promoter regions of transcription factor and interactions with RNA binding proteins, RNA modifications, as well as microRNAs. Here we take active promoters and microRNA bindings as examples to illustrate these modules (Fig. 4, Fig. 5).
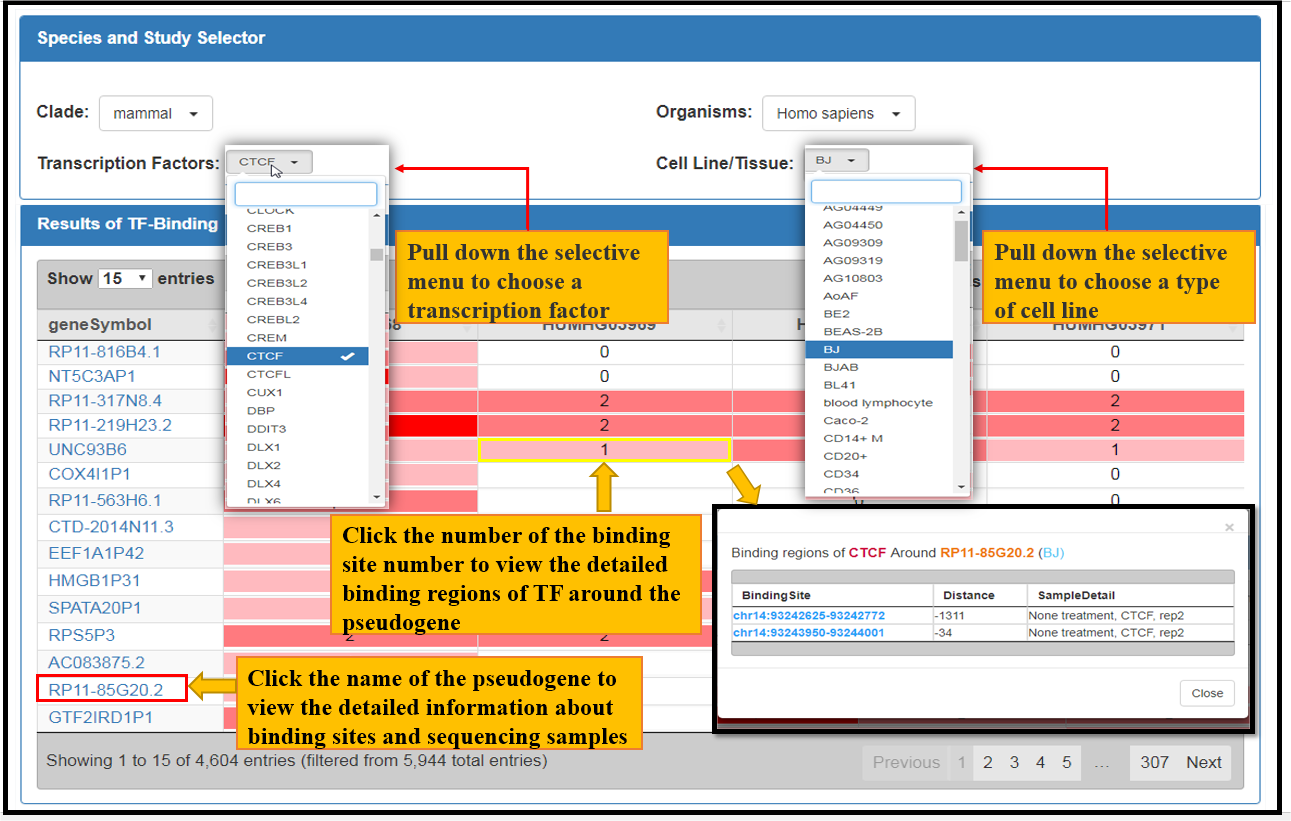
Fig. 4 The facets of CTCF Bindings in BJ Cell Line
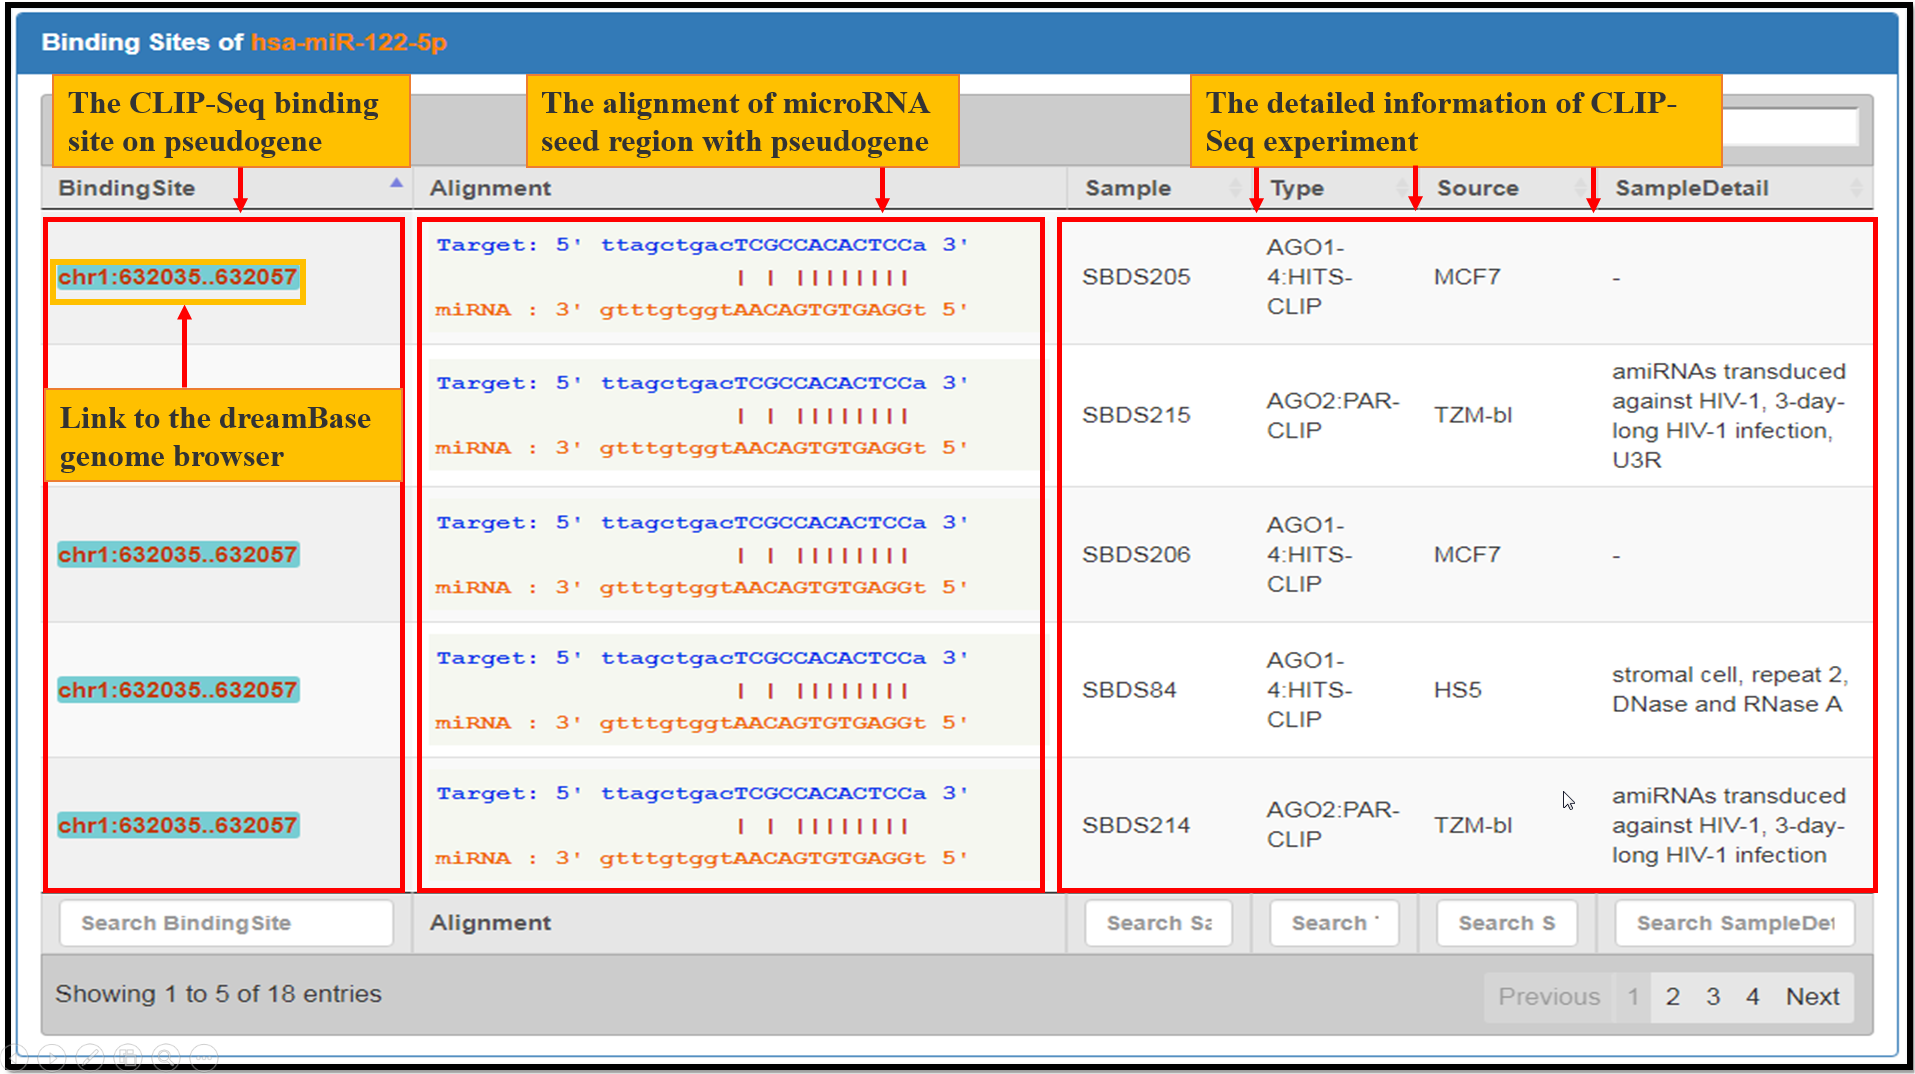
Fig. 5 The facets of microRNA Bindings
Network
The Network Module provides two special web-based tools: coExp-pseudo, which is used to explore co-expression patterns between pseudogenes and their parent genes (Fig. 6), and ceRNA-pseudo, which is used to visualize the crosstalk between pseudogenes and their parent genes by competitive binding of microRNAs (Fig. 7 and Fig. 8).
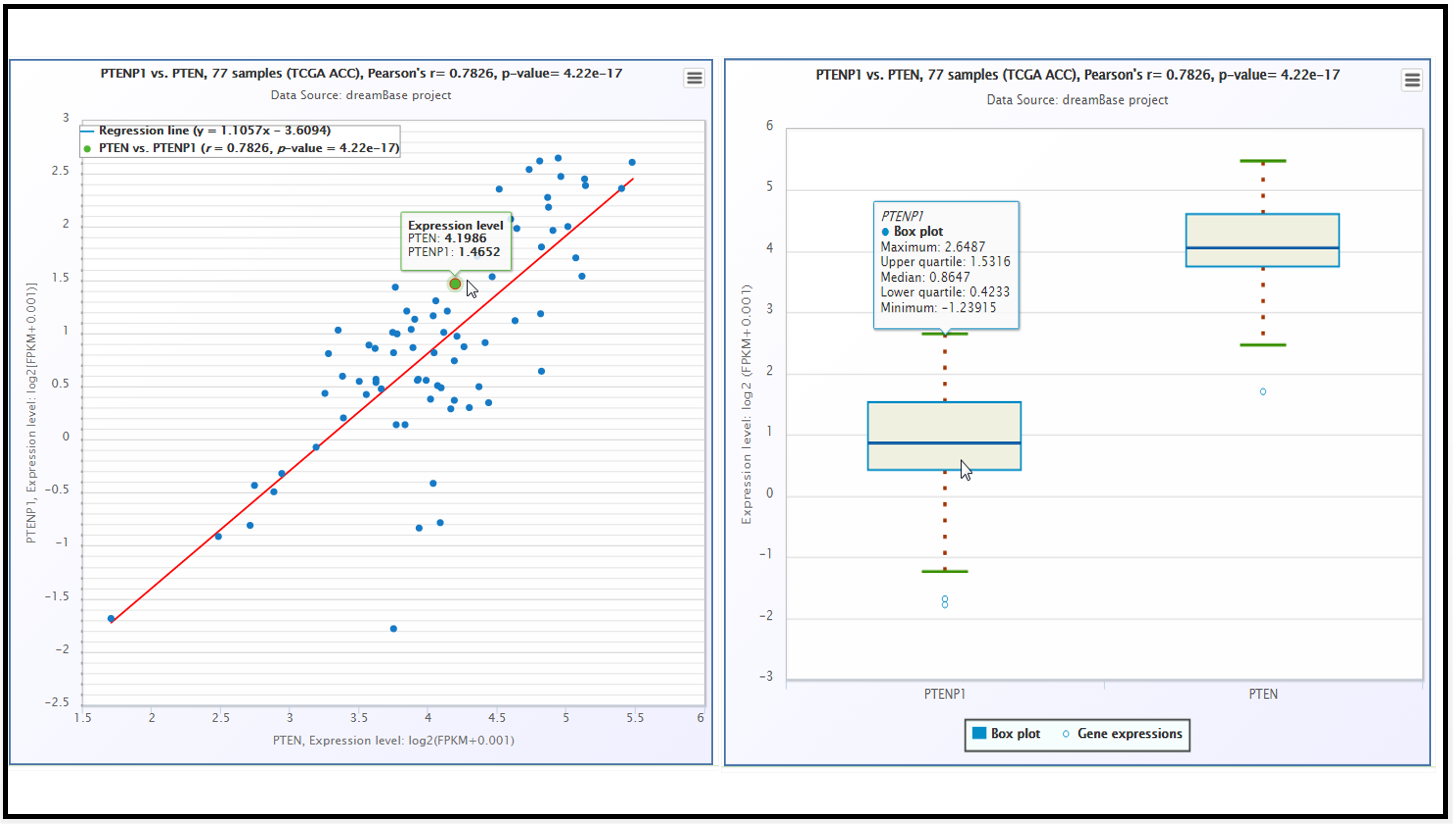
Fig. 6 The scatter plot and boxplot of co-expression patterns between ABCC6P1 pseudogene and its parent gene ABCC6.
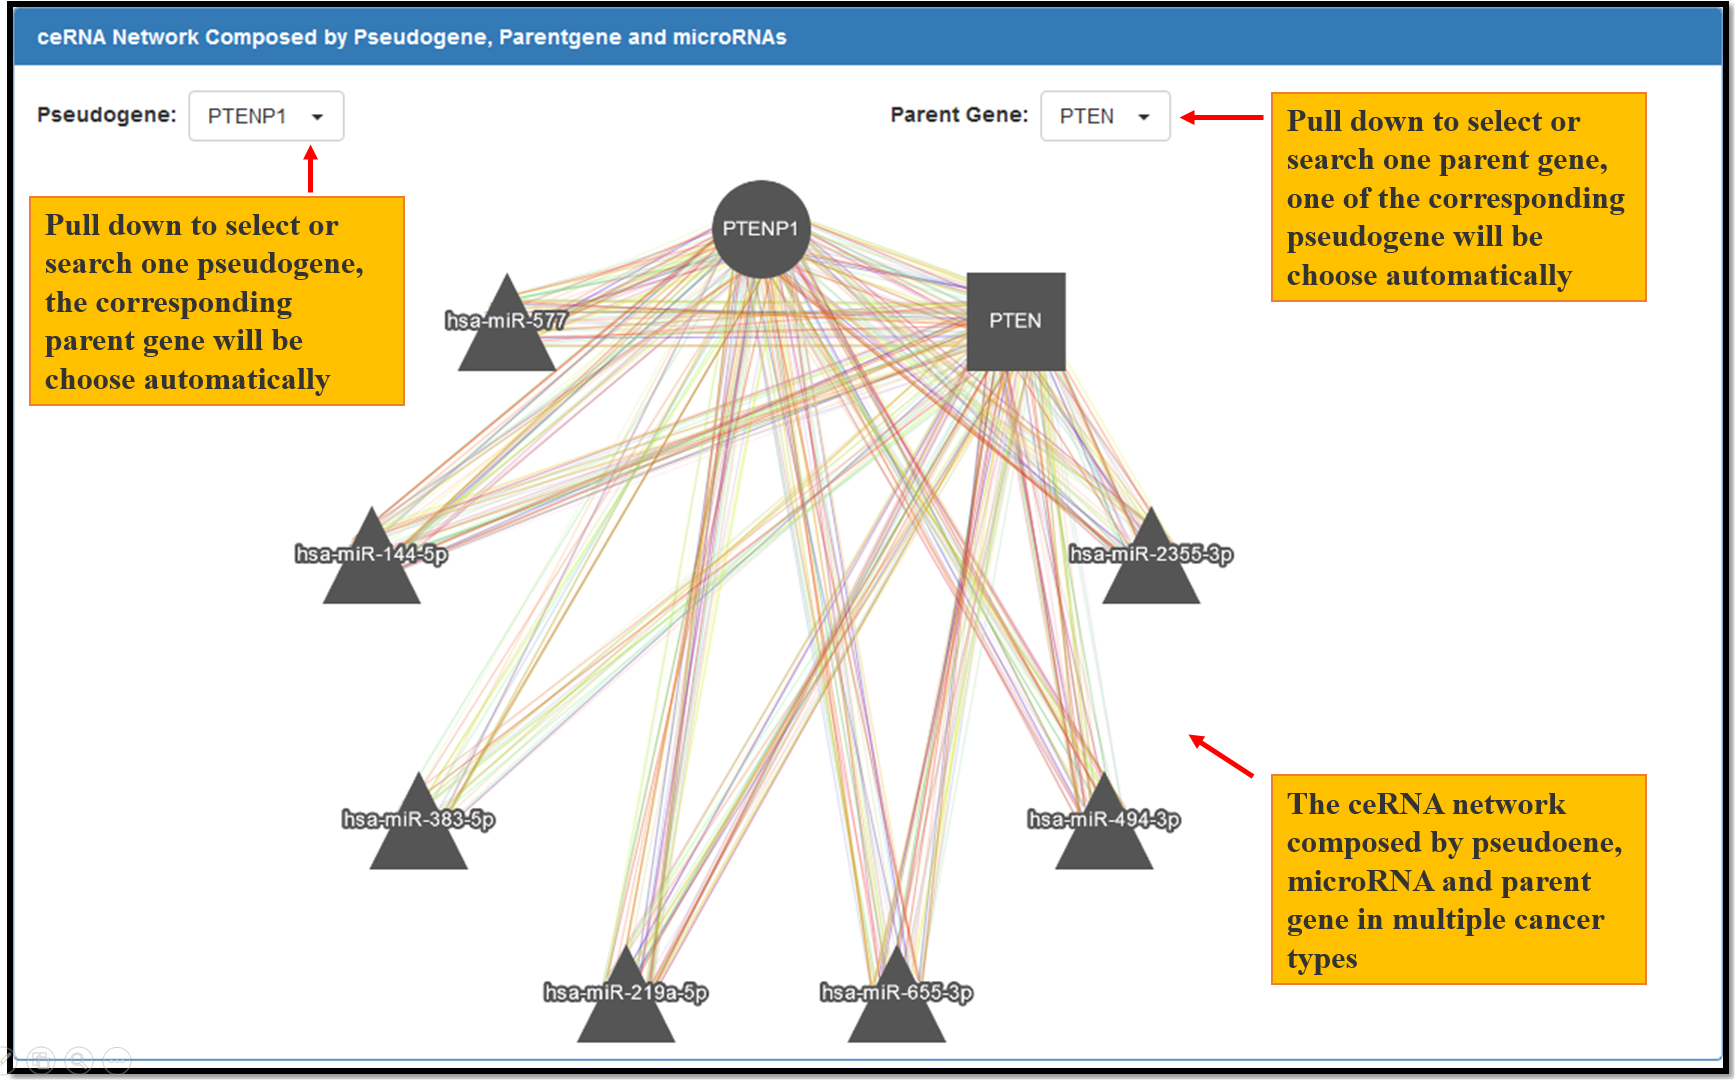
Fig. 7 The ceRNA network composed by pseudogene, microRNA and parent gene in multiple cancer types. Each node represents a gene, the circle node represents pseudogene, the square node represents parent gene and the triangle node represent microRNAs. Each edge represents a co-expression relationship between the two nodes in one type of the cancer. Different edge color represents different types of cancers.

Fig. 8 The co-expression information of microRNA-pseudogene, microRNA-parentgene and pseudogene-parentgene in the ceRNA network.
Browser
dreamBase Genome Browser is a powerfull genome browser which is built on JBrowse and helps users easily visualize reference sequences, gene annotations, various ChIP-seq data, etc. The usage is desribed as Fig. 9
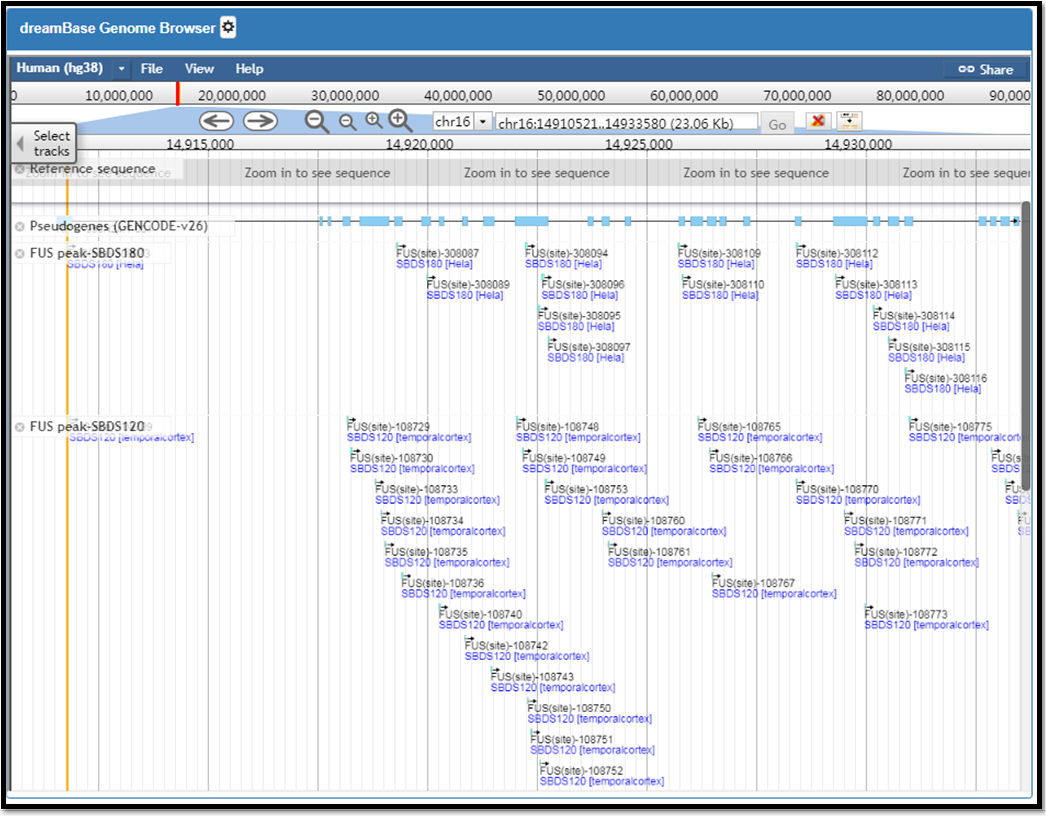
Fig. 9 The dreamBse genome browser