Introduction
tsRFun evaluated the tsRNA expression pattern and prognosis values in 32 types of cancers, and demostrated their biological functions utilizing high-throughput CLASH/CLEAR or CLIP sequencing data. In summary, tsRFun provides an effective data resource and analysis tool for studying the function and role of tsRNA in cancer.
Note: For better browse experience, Chrome is strongly recommended. Firefox 61, Opera 54, Safari 5 and Microsoft Edge are also supported. IE 7-11 and IE-core browsers are not supported.
Search 
tsRFun supports multiple ways for users to search for specific tsRNAs in search page:
1) Enter sequence ;
2) Enter tsRNA id;
3) Enter the tRNA name or select by the amino acid, codon of tRNA, and the tsRNA type;
4) Enter the gene name.
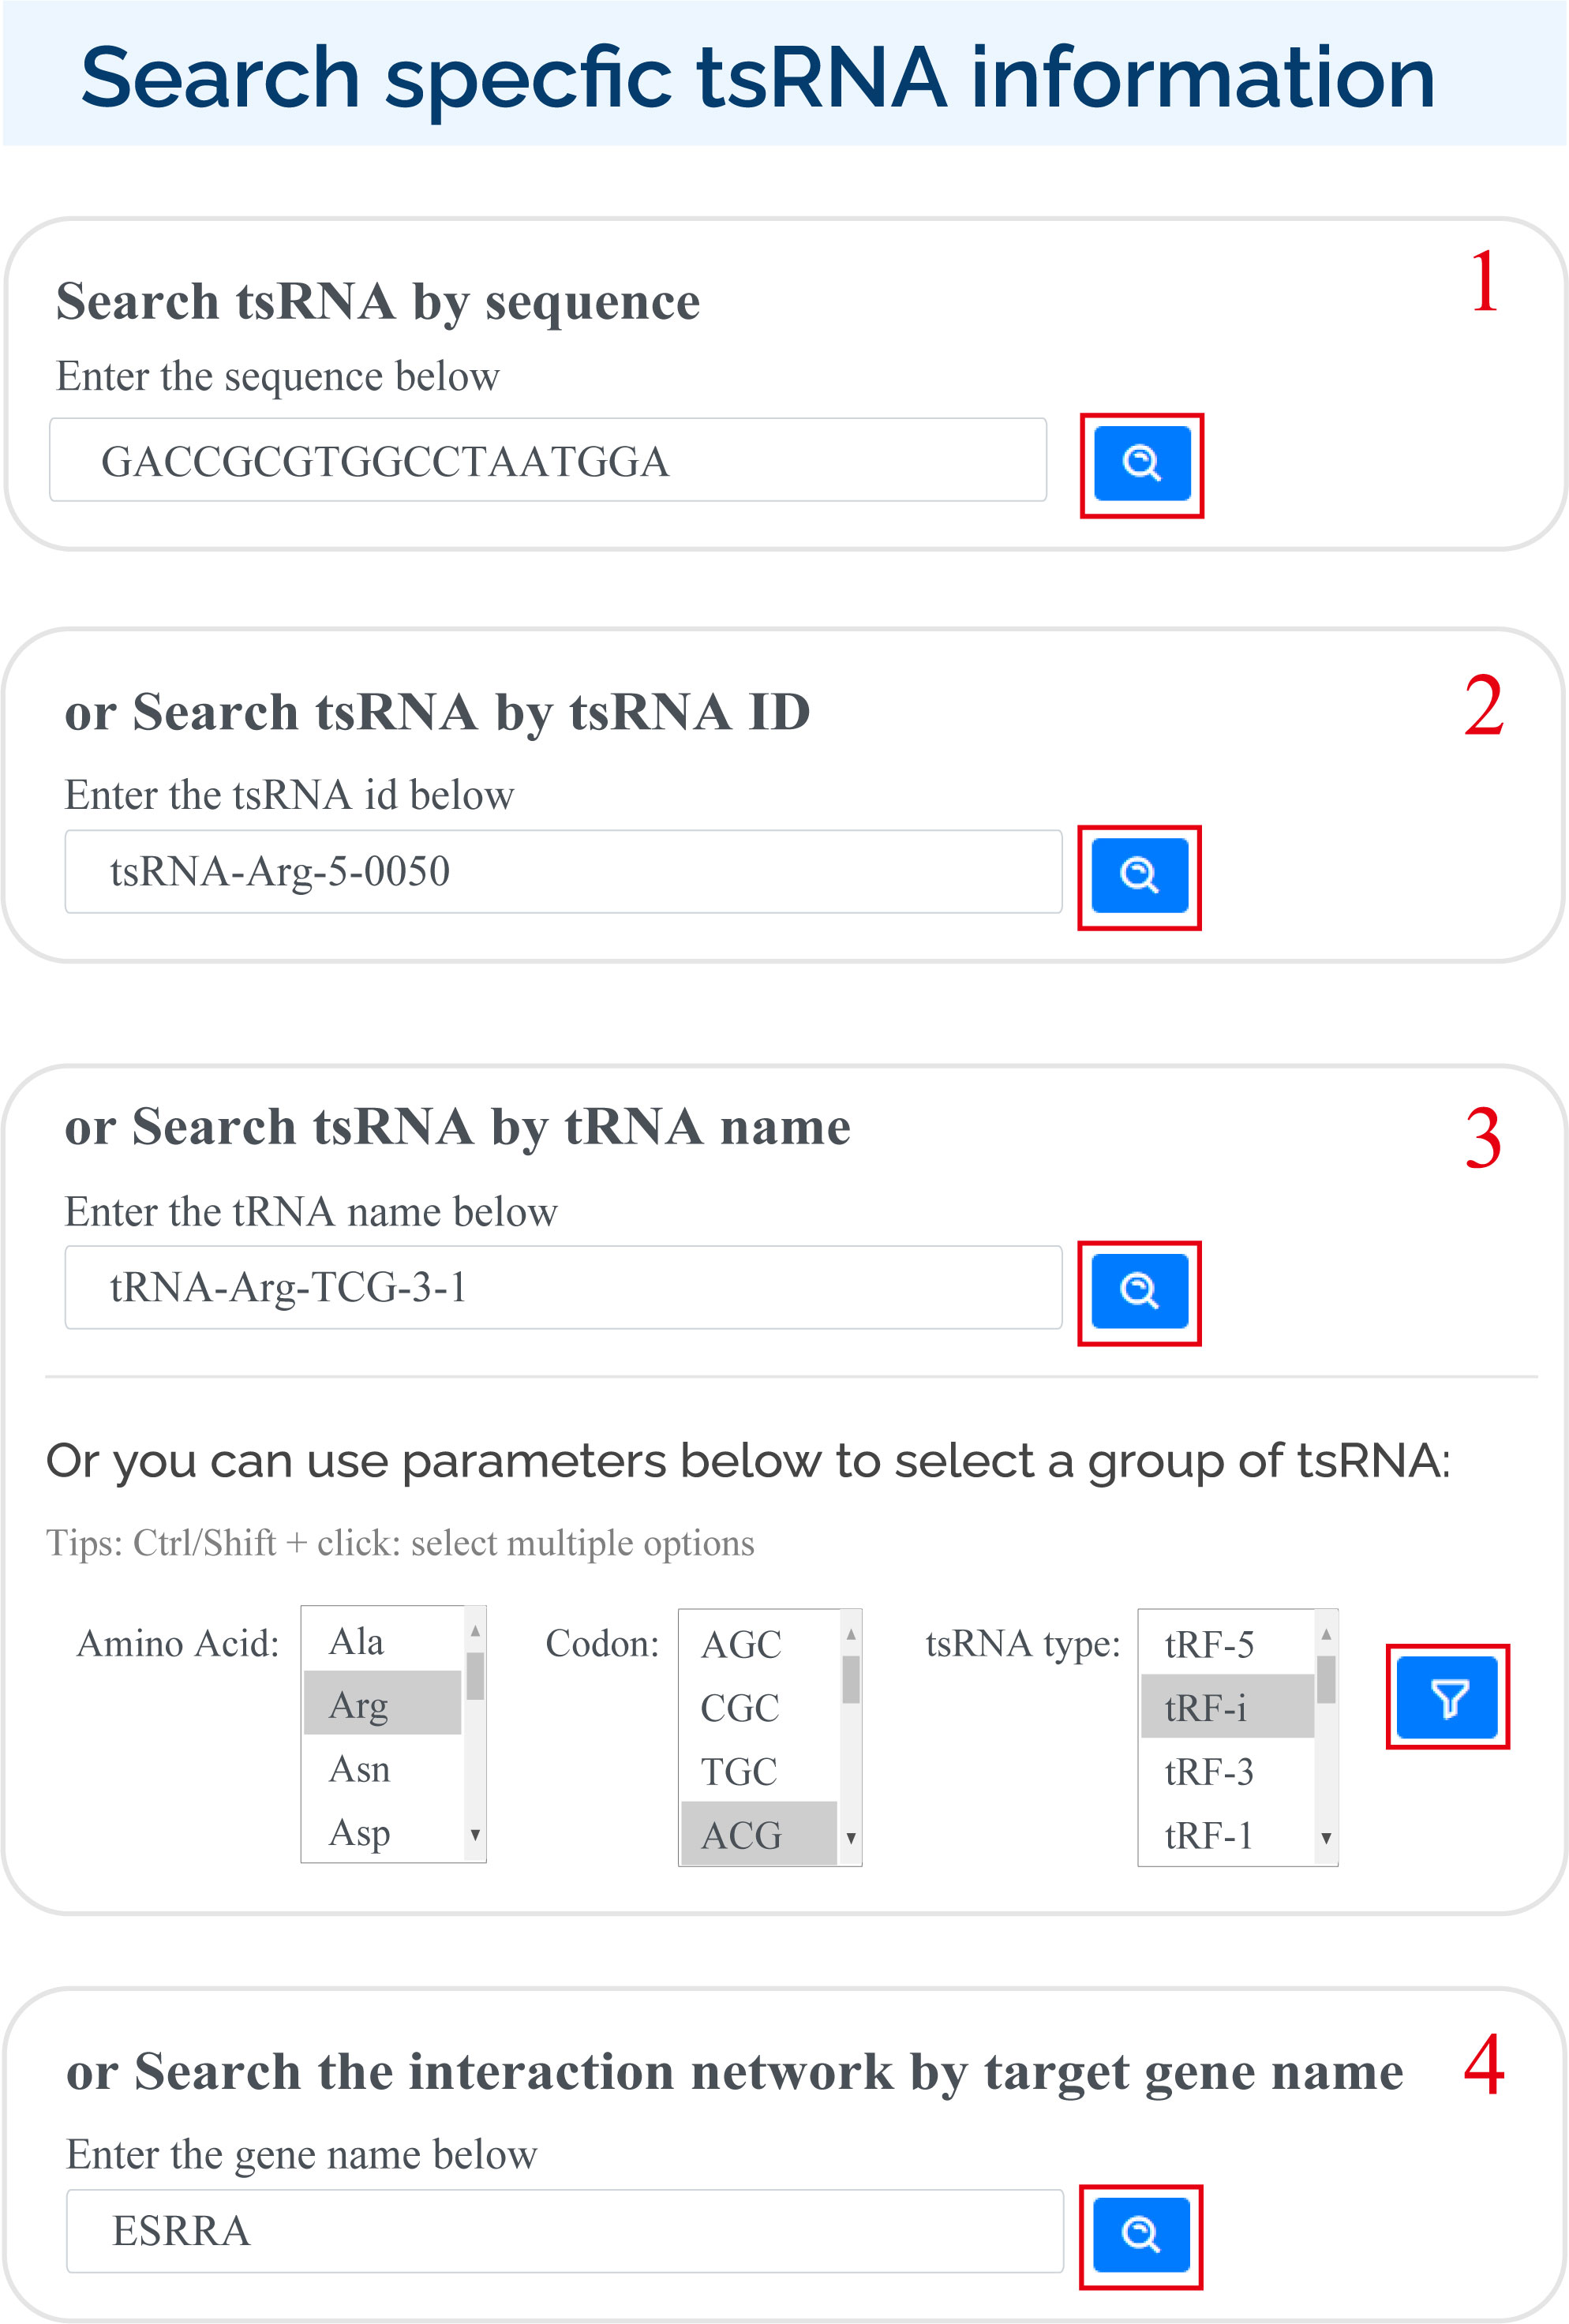
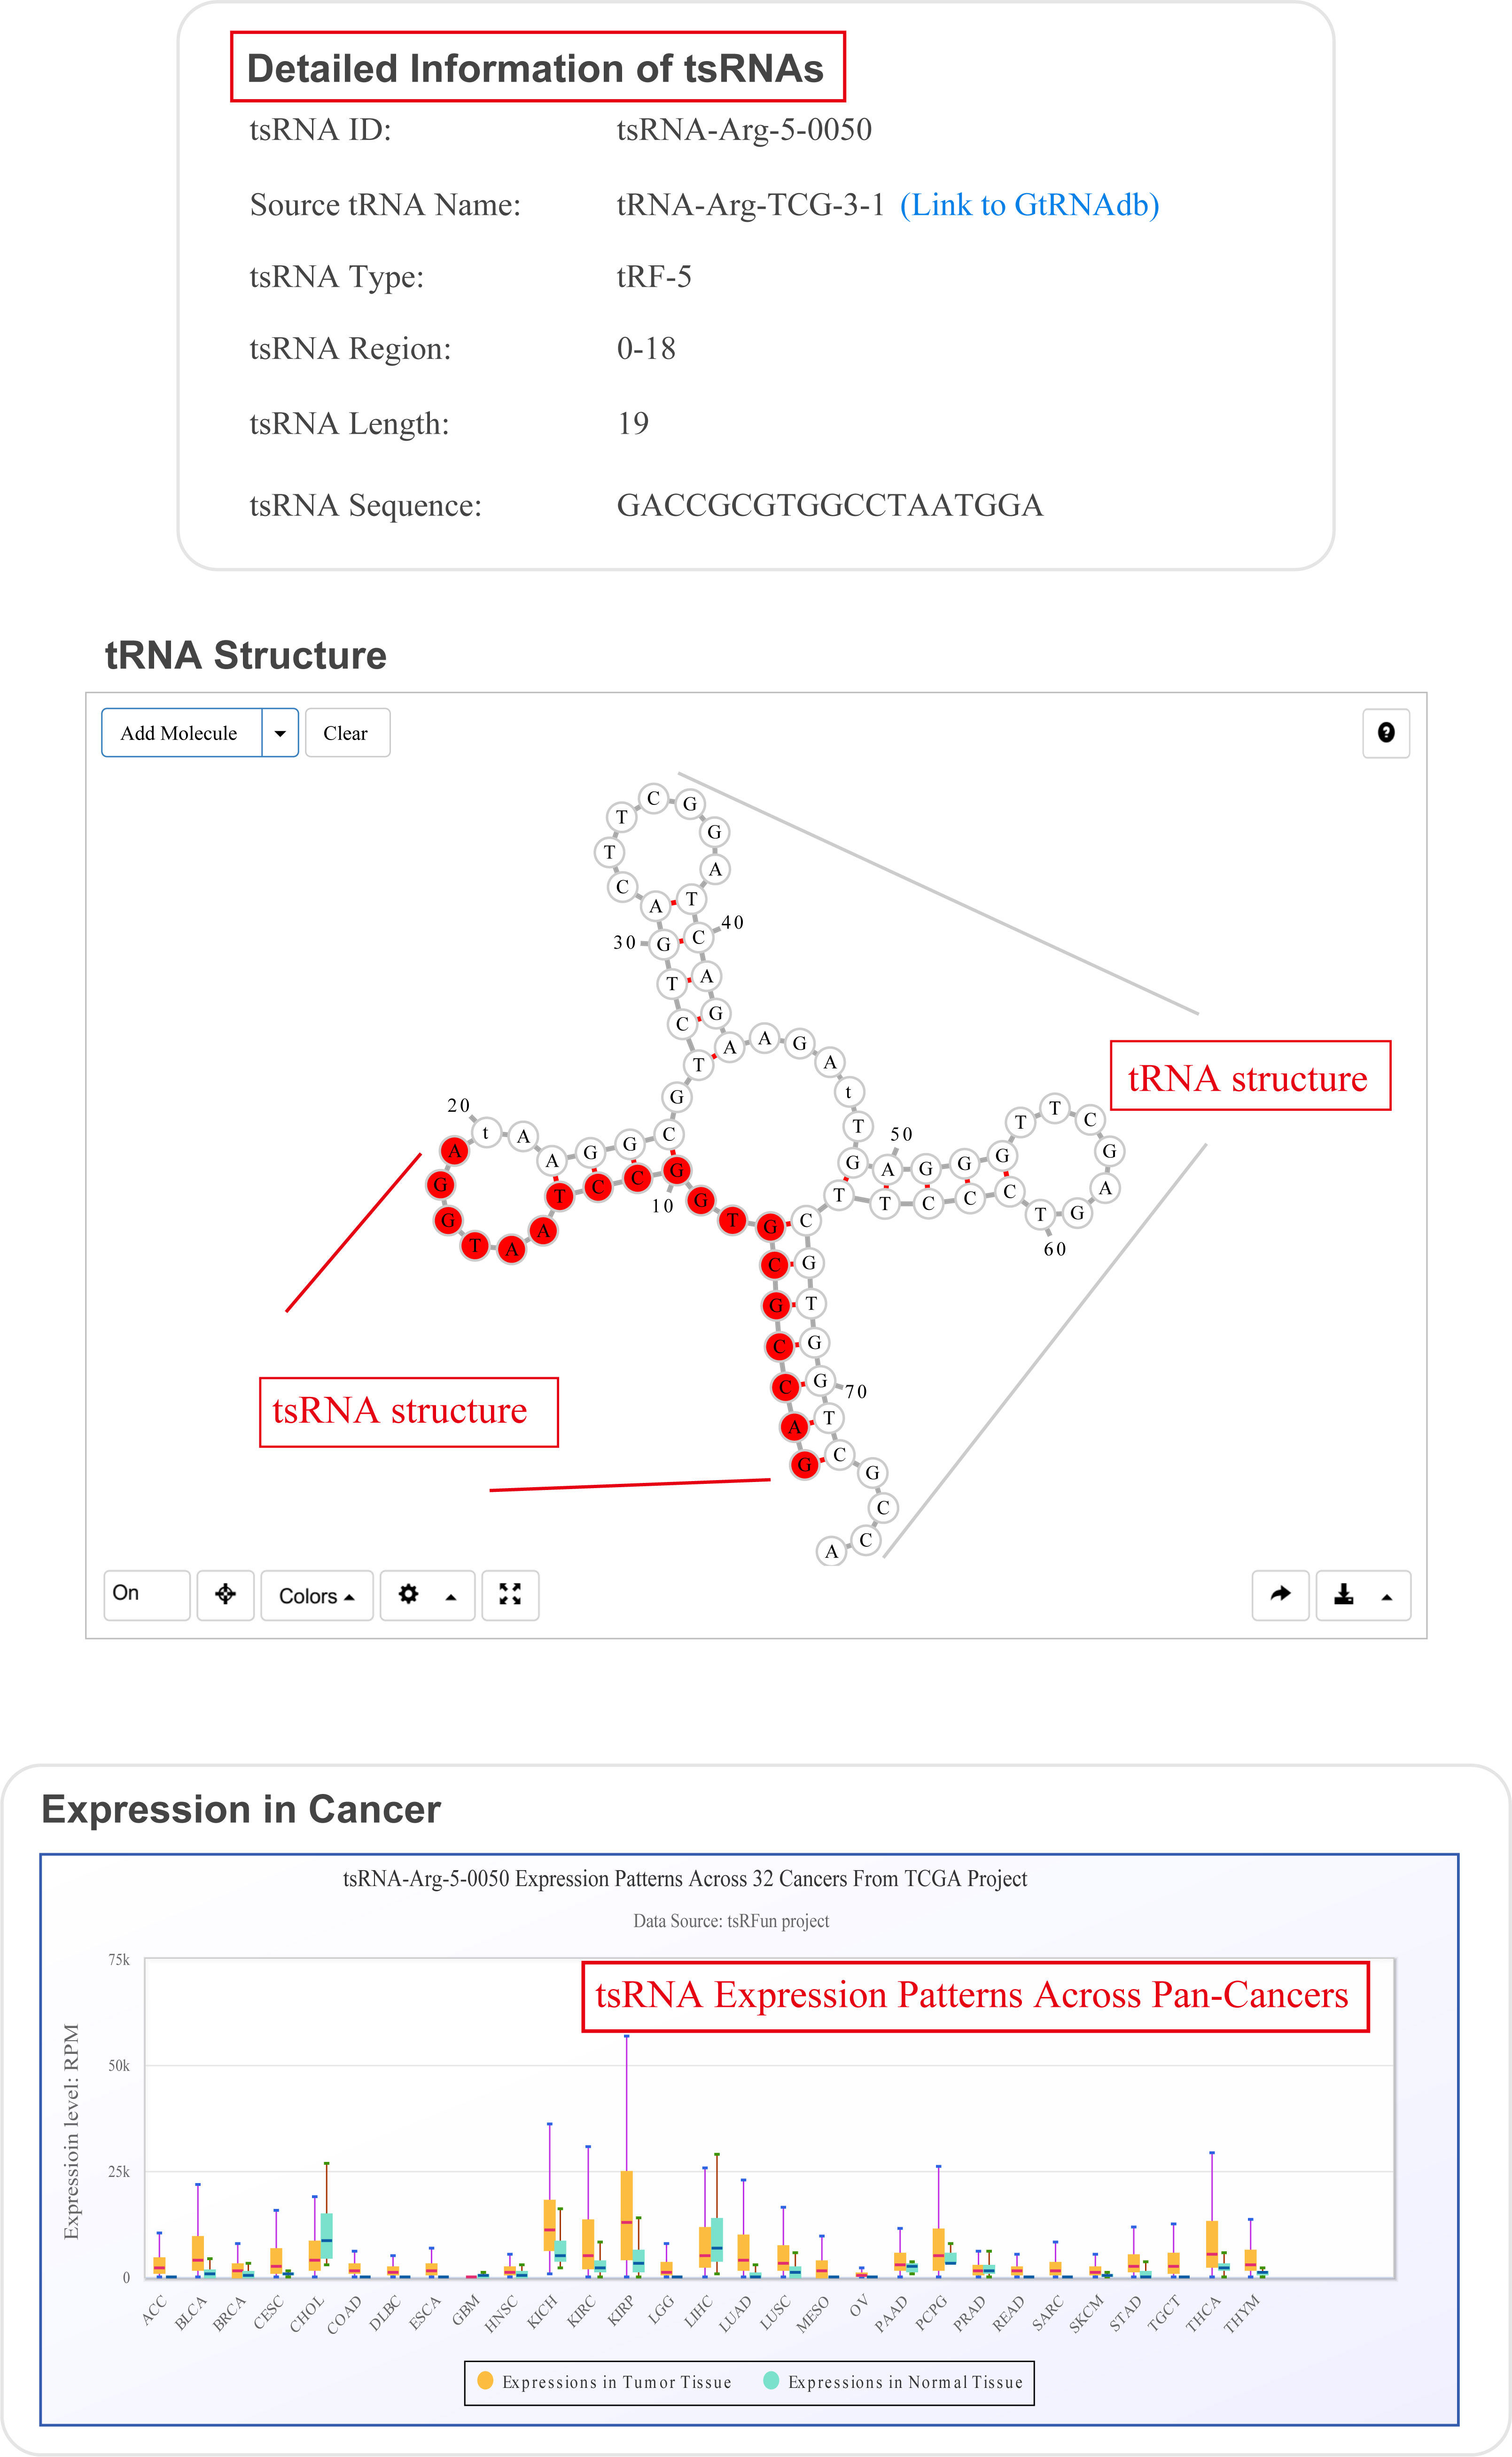
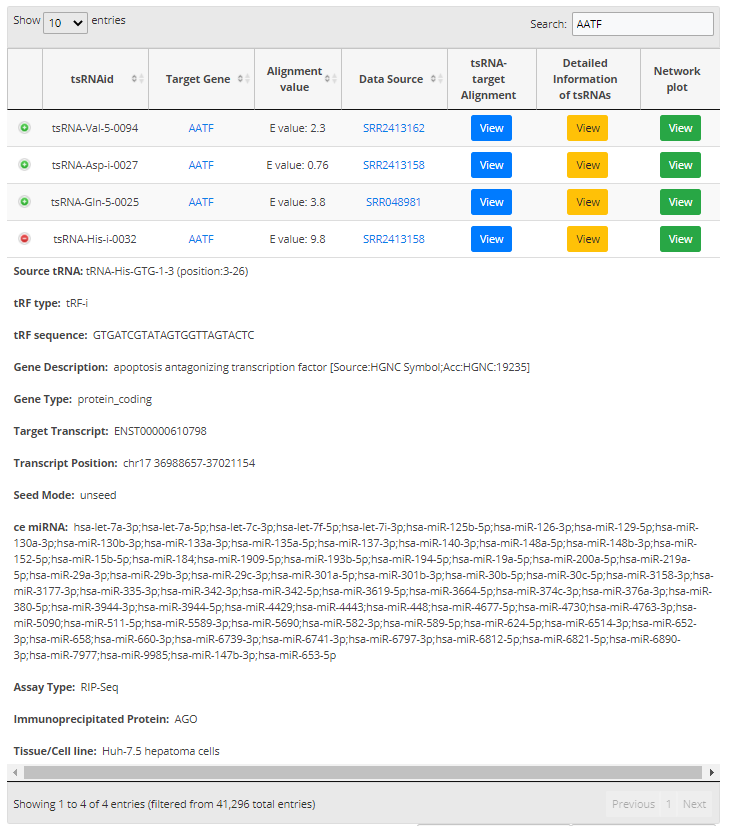
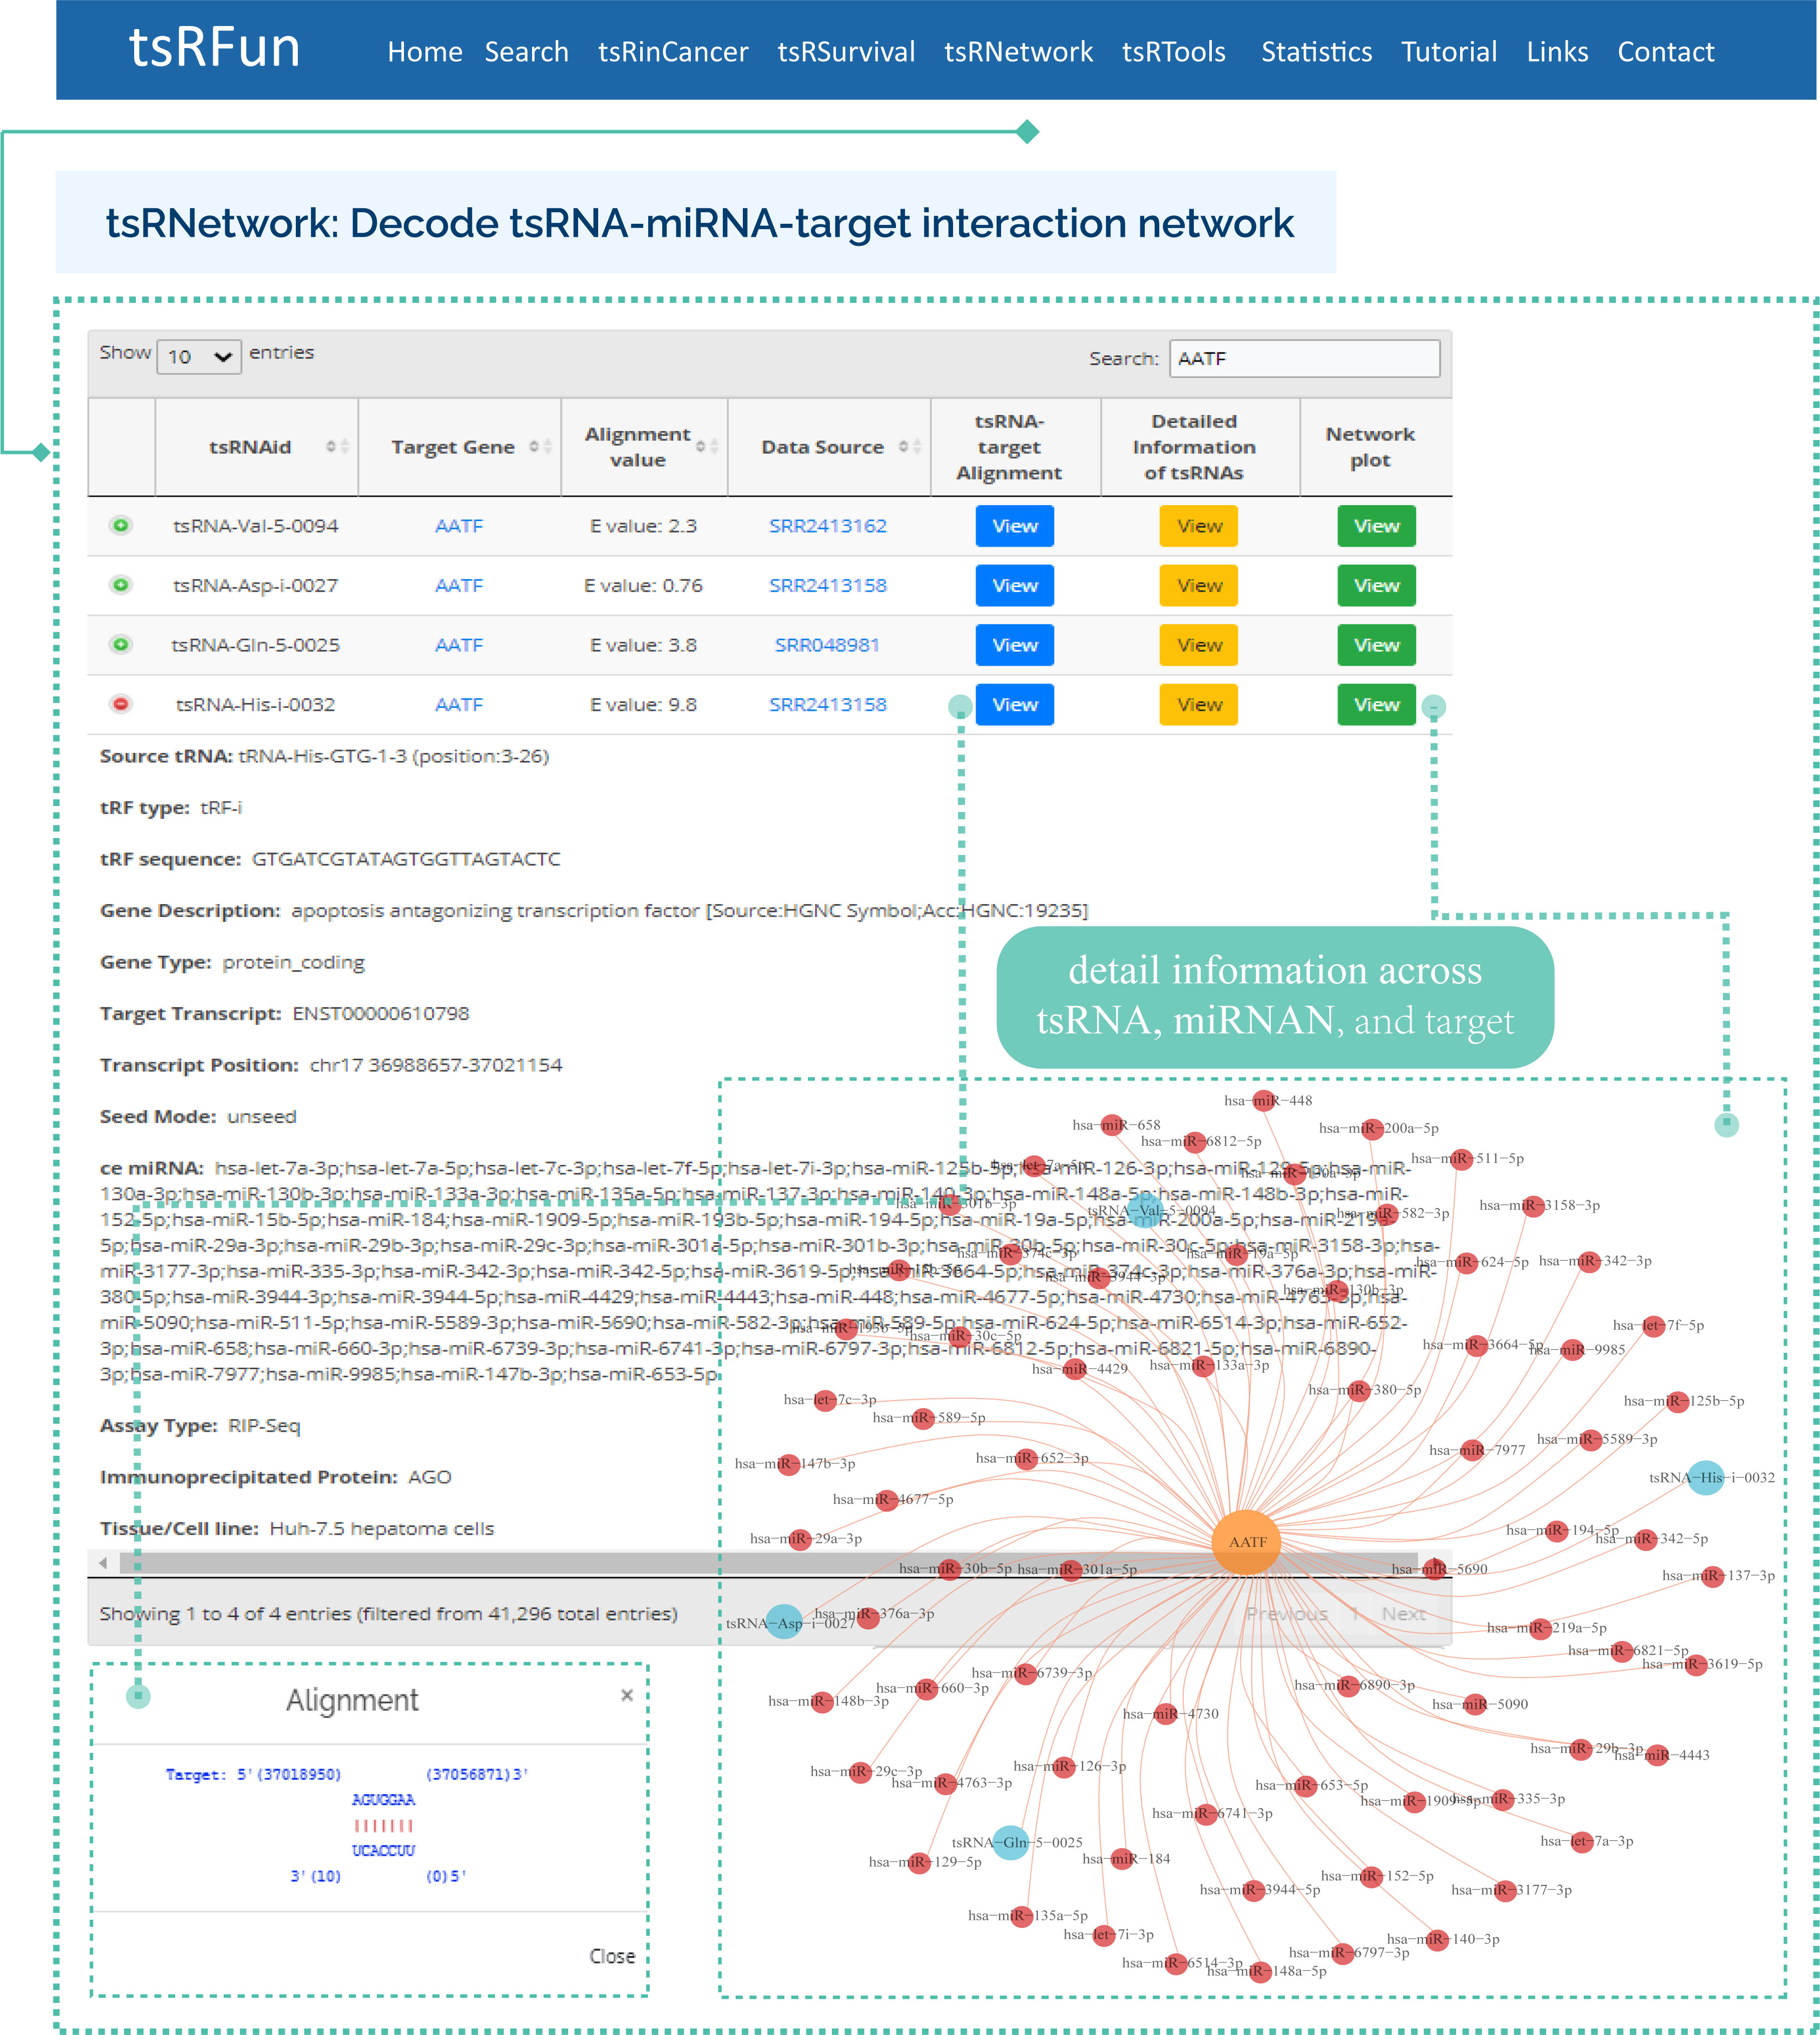
For search pattern 1 or pattern 2, if user inputs the sequence of "GACCGCGTGGCCTAATGGA" or the tsRNAid of "tsRNA-Arg-5-0050", tsRFun will generate a detail information of tsRNA and its targets.
For search pattern 3, if user inputs the "tRNA name" or the "tsRNA type", tsRFun will generate the correlated tsRNAs derived from the tRNA.
For search pattern 4, if user inputs the "gene name", tsRFun will generate the interaction network across the tsRNA, miRNA, and target gene.
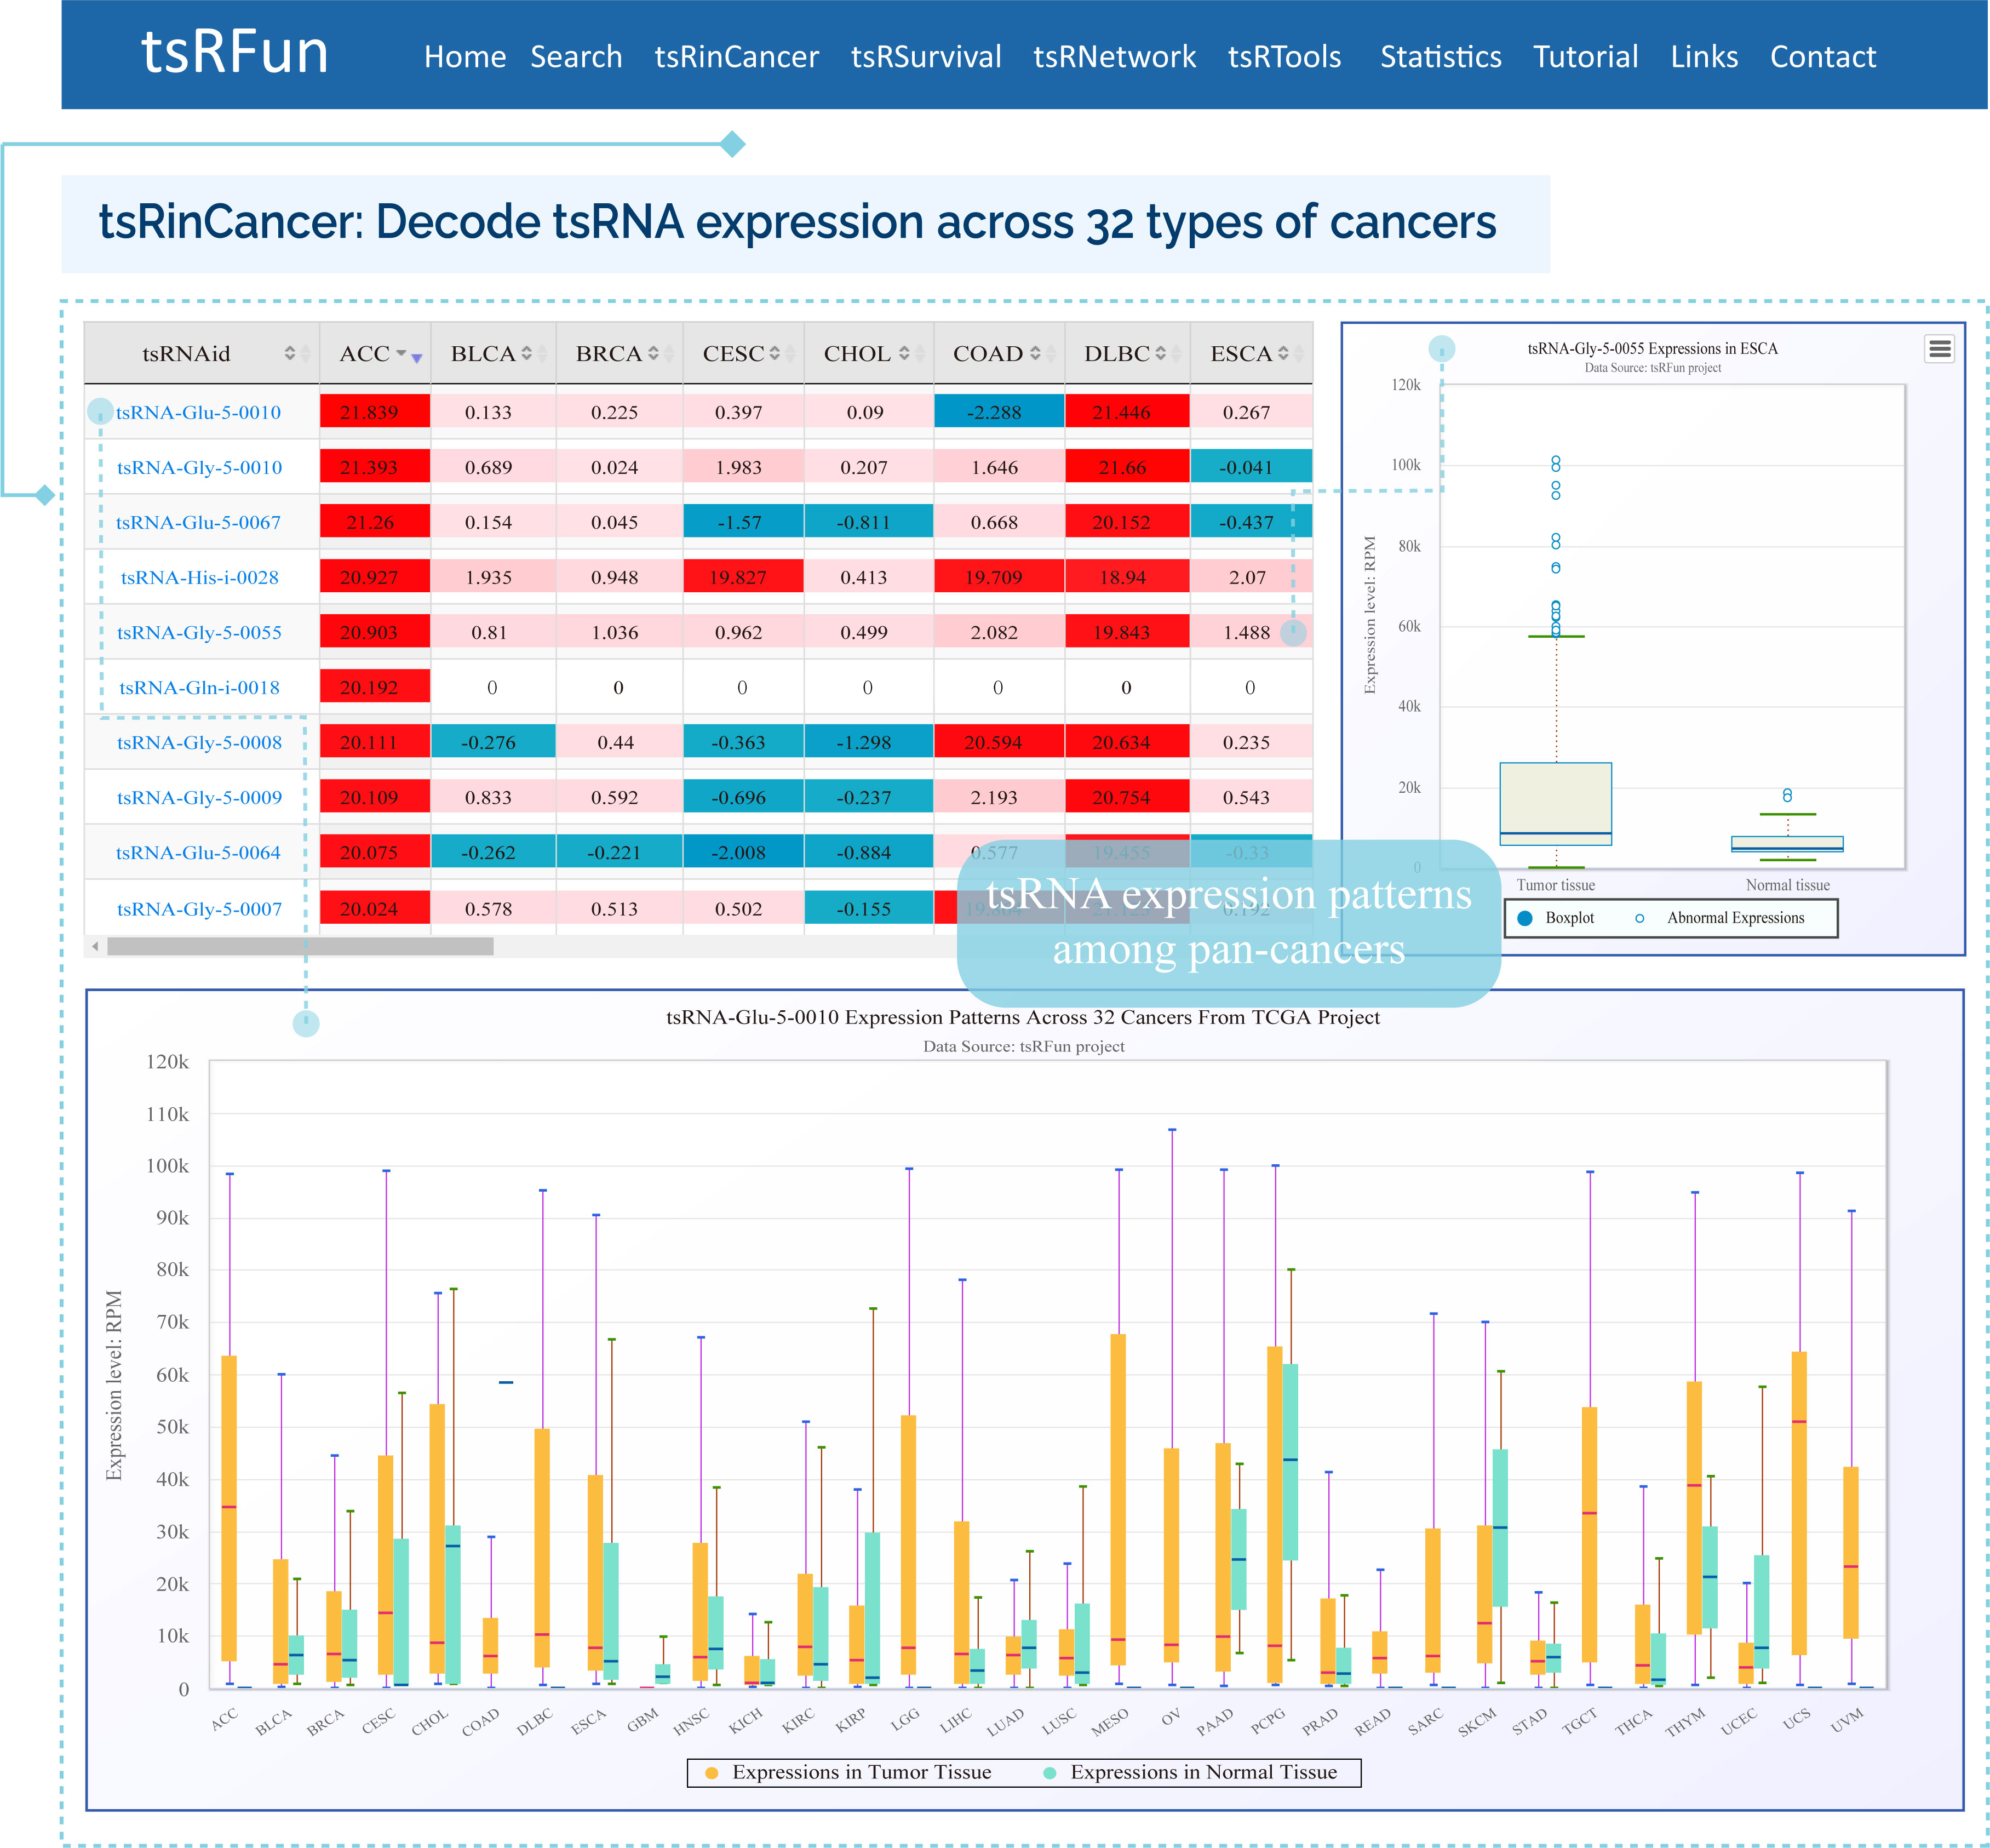
tsRinCancer
The "tsRinCancer" evaluates the tsRNA expression pattern in 32 types of cancers
¶ tsRinCancer investigates the tsRNA expression in pan-cancers base on 3T raw small RNA sequence data of 10572 samples, and provides an integrated view of the tsRNAs expression among 32 cancer types.
¶ tsRinCancer visualizes the value of average RPM of all the samples as a box plot and bar plot, and the log2 fold change of tumor expression over normal expression as a heatmap.
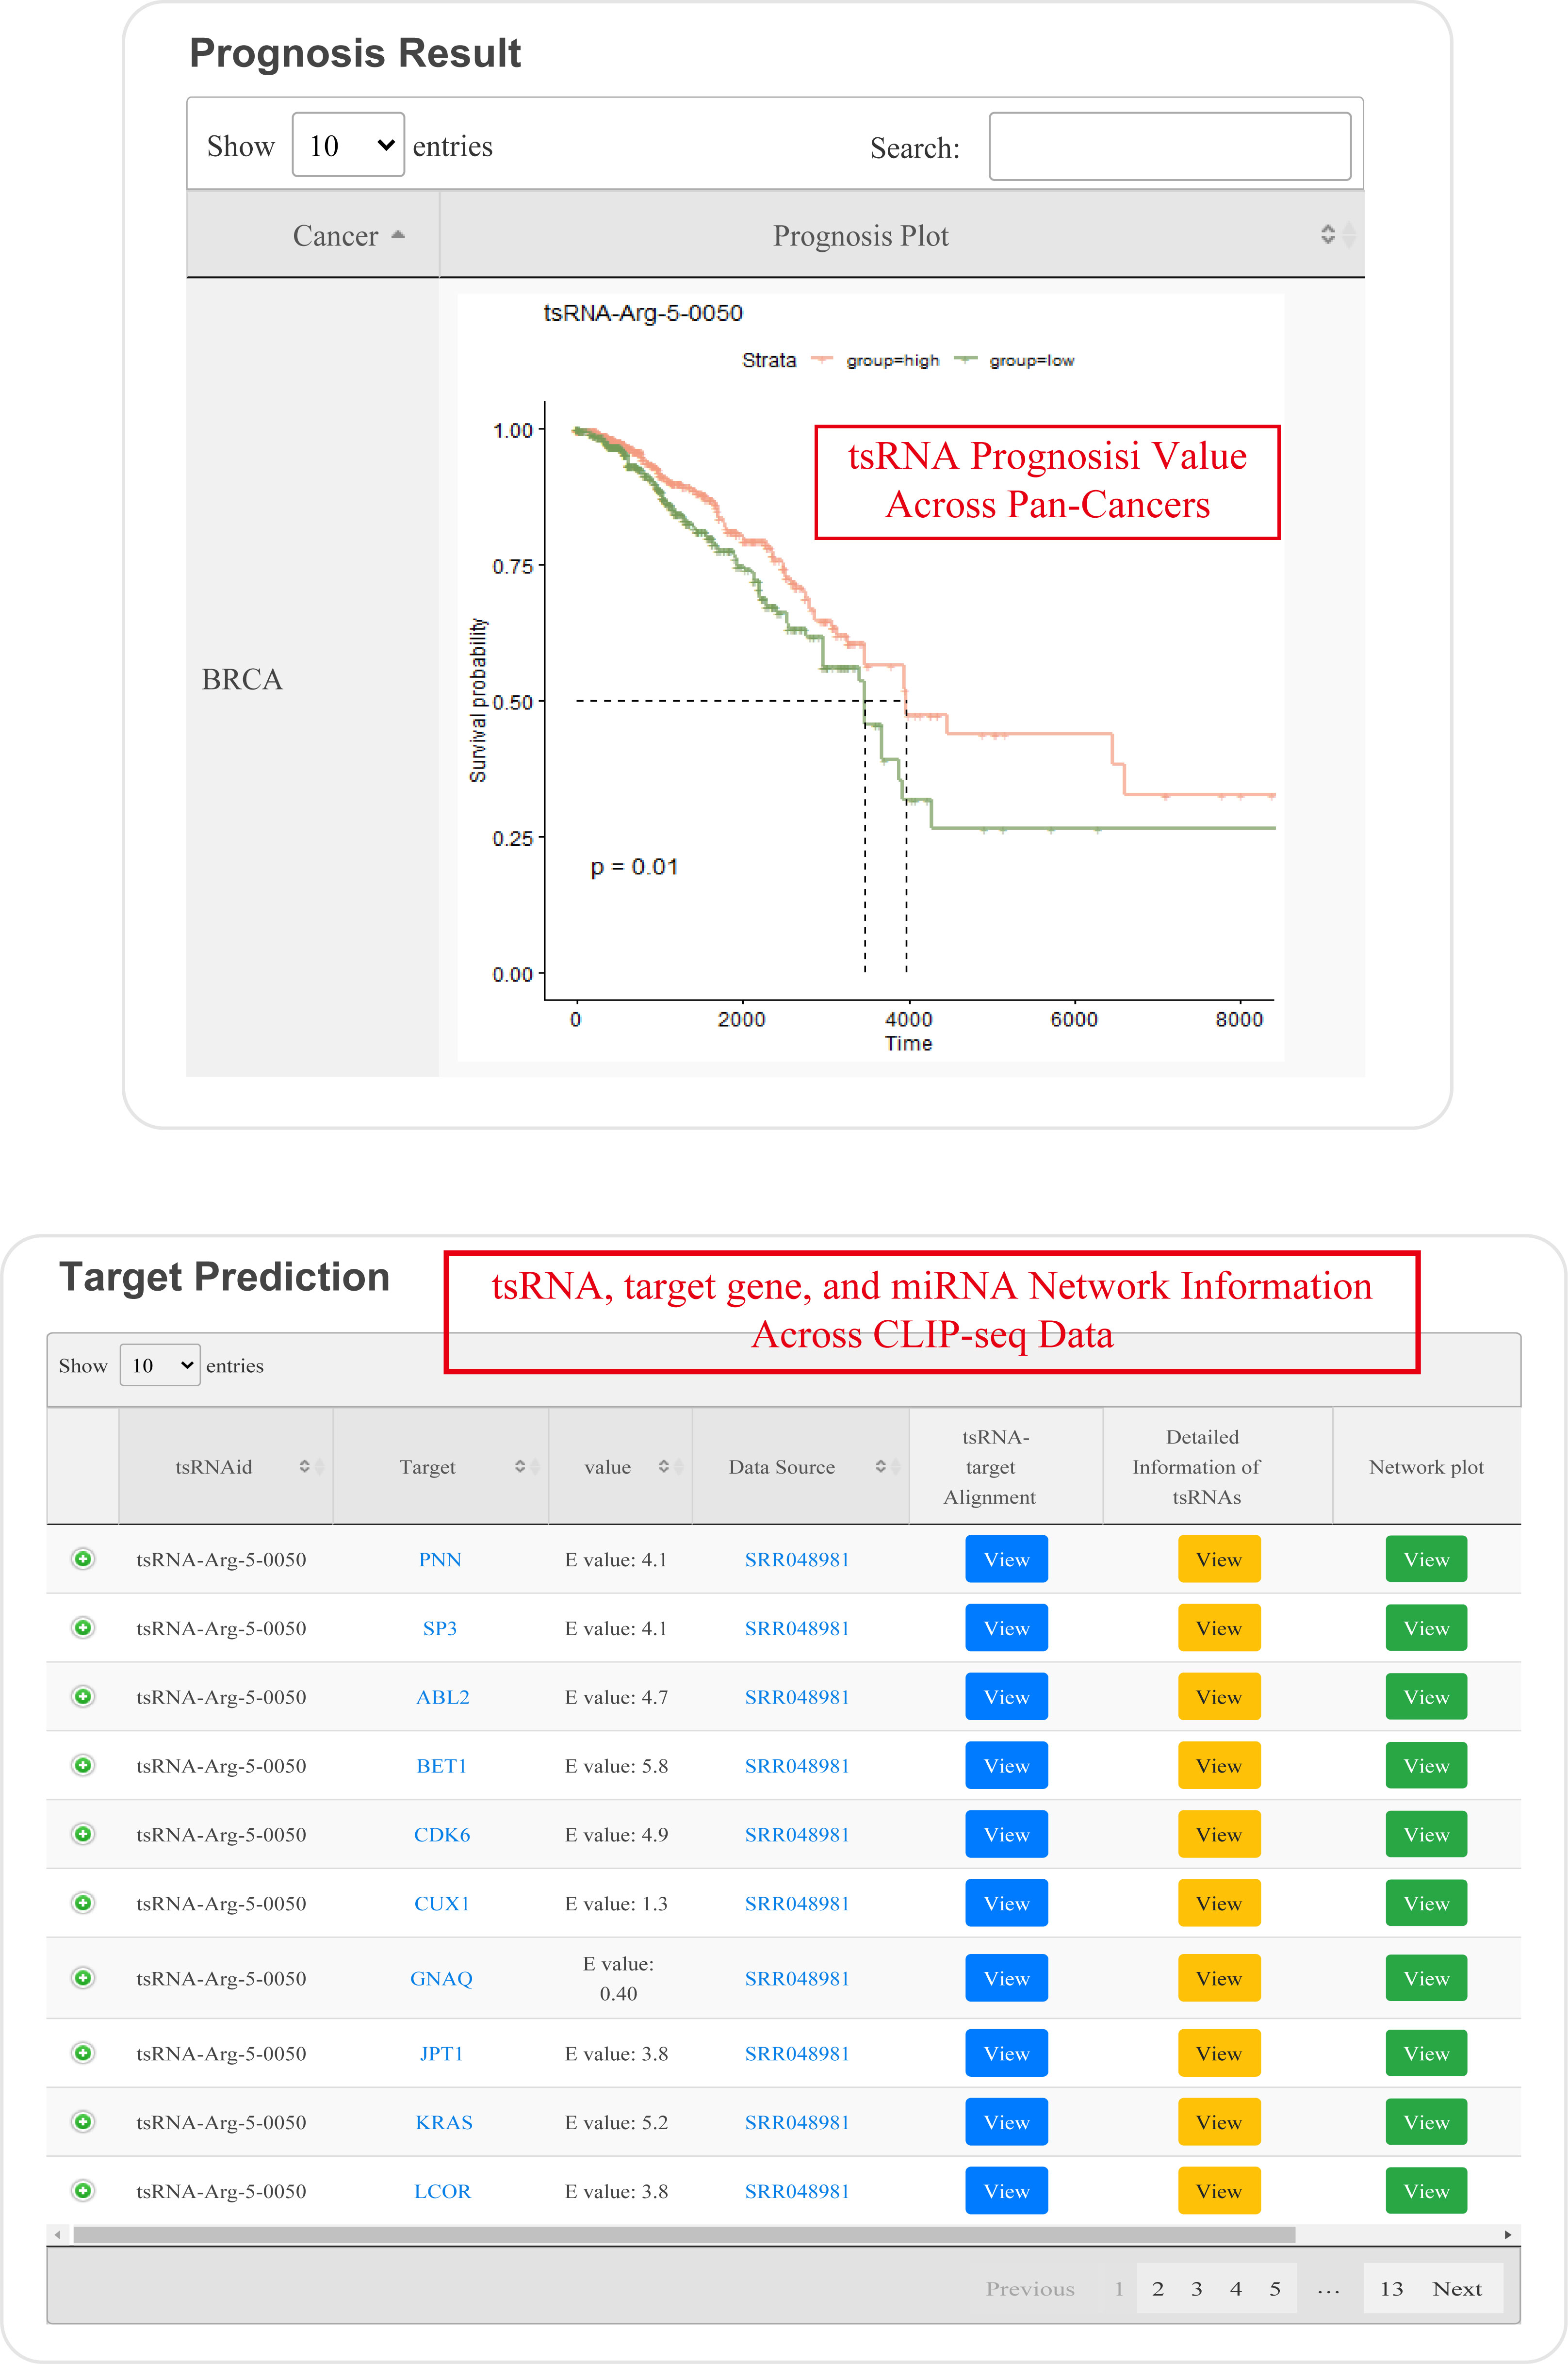
tsRSurvival
The "tsRSurvival" evaluates the prognosis values in 32 types of cancers
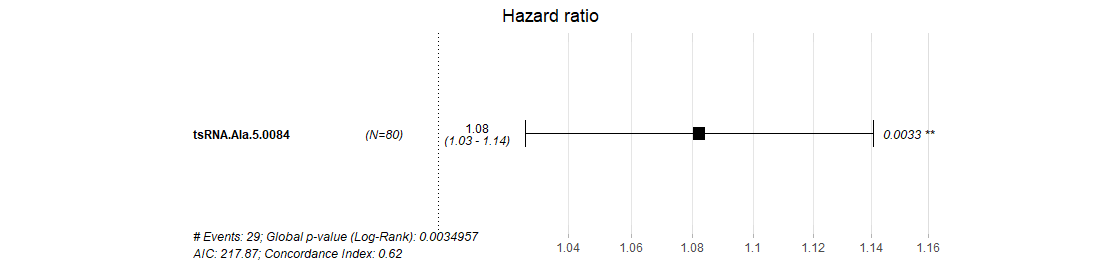
¶ tsRSurvival calculates the prognosis value of tsRNAs in different cancer types by the Kaplan-Meier method and log-rank test.

¶ Also calculates the Univariate Cox-regression analysis of tsRNAs in different cancer types.
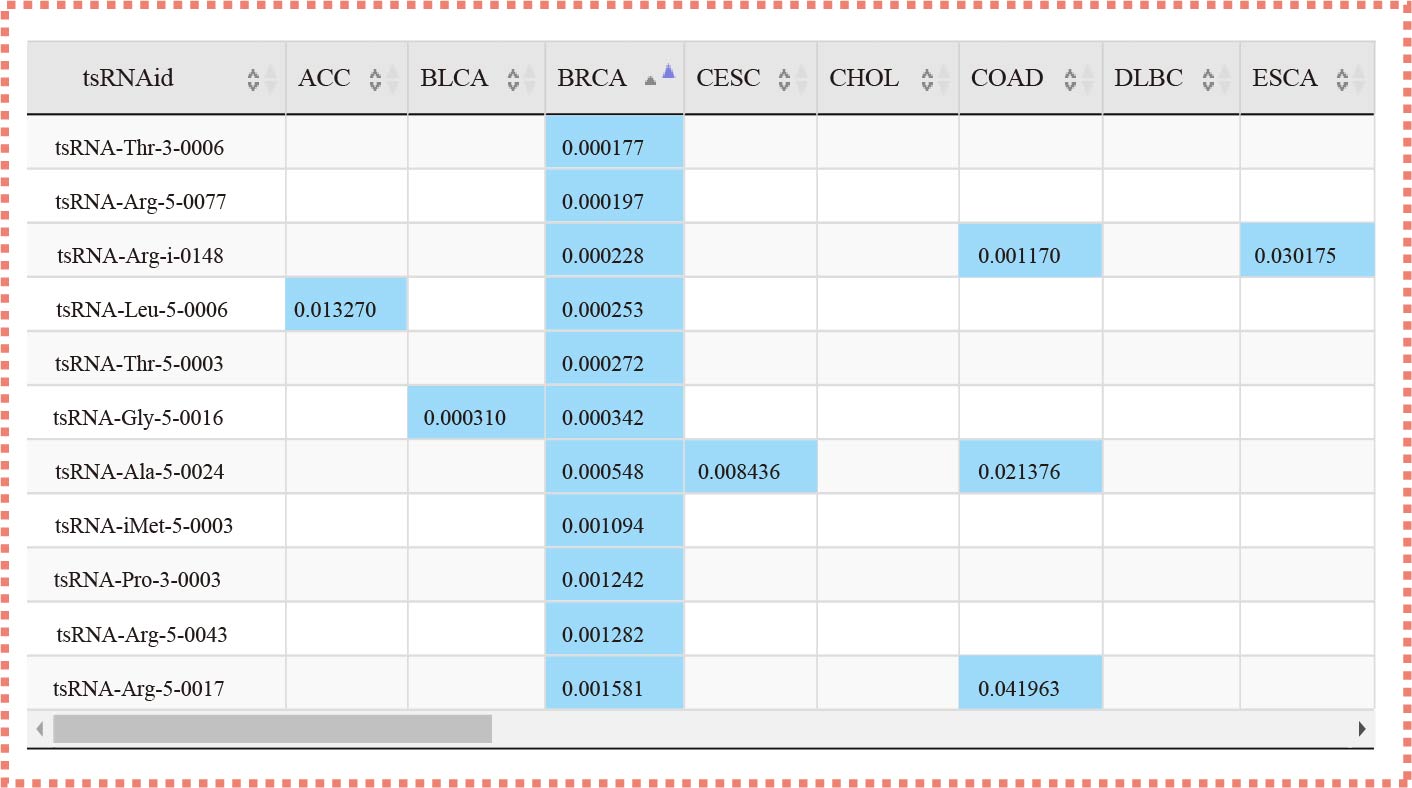
¶ After clicking the highlight p-value in the table, the detail plot shows the relationship between special tsRNA and survival in different cancer types.
tsRNetwork
The "tsRNetwork" builds the ceRNA network among tsRNA, microRNA and mRNA by hypergeometric test.
Data-Preprocess
tsRFun provide two real-time online tools, tsRFinder and tsRTarget, for users to upload their own sequence data to identify tsRNAs and predict tsRNA-target interactions.
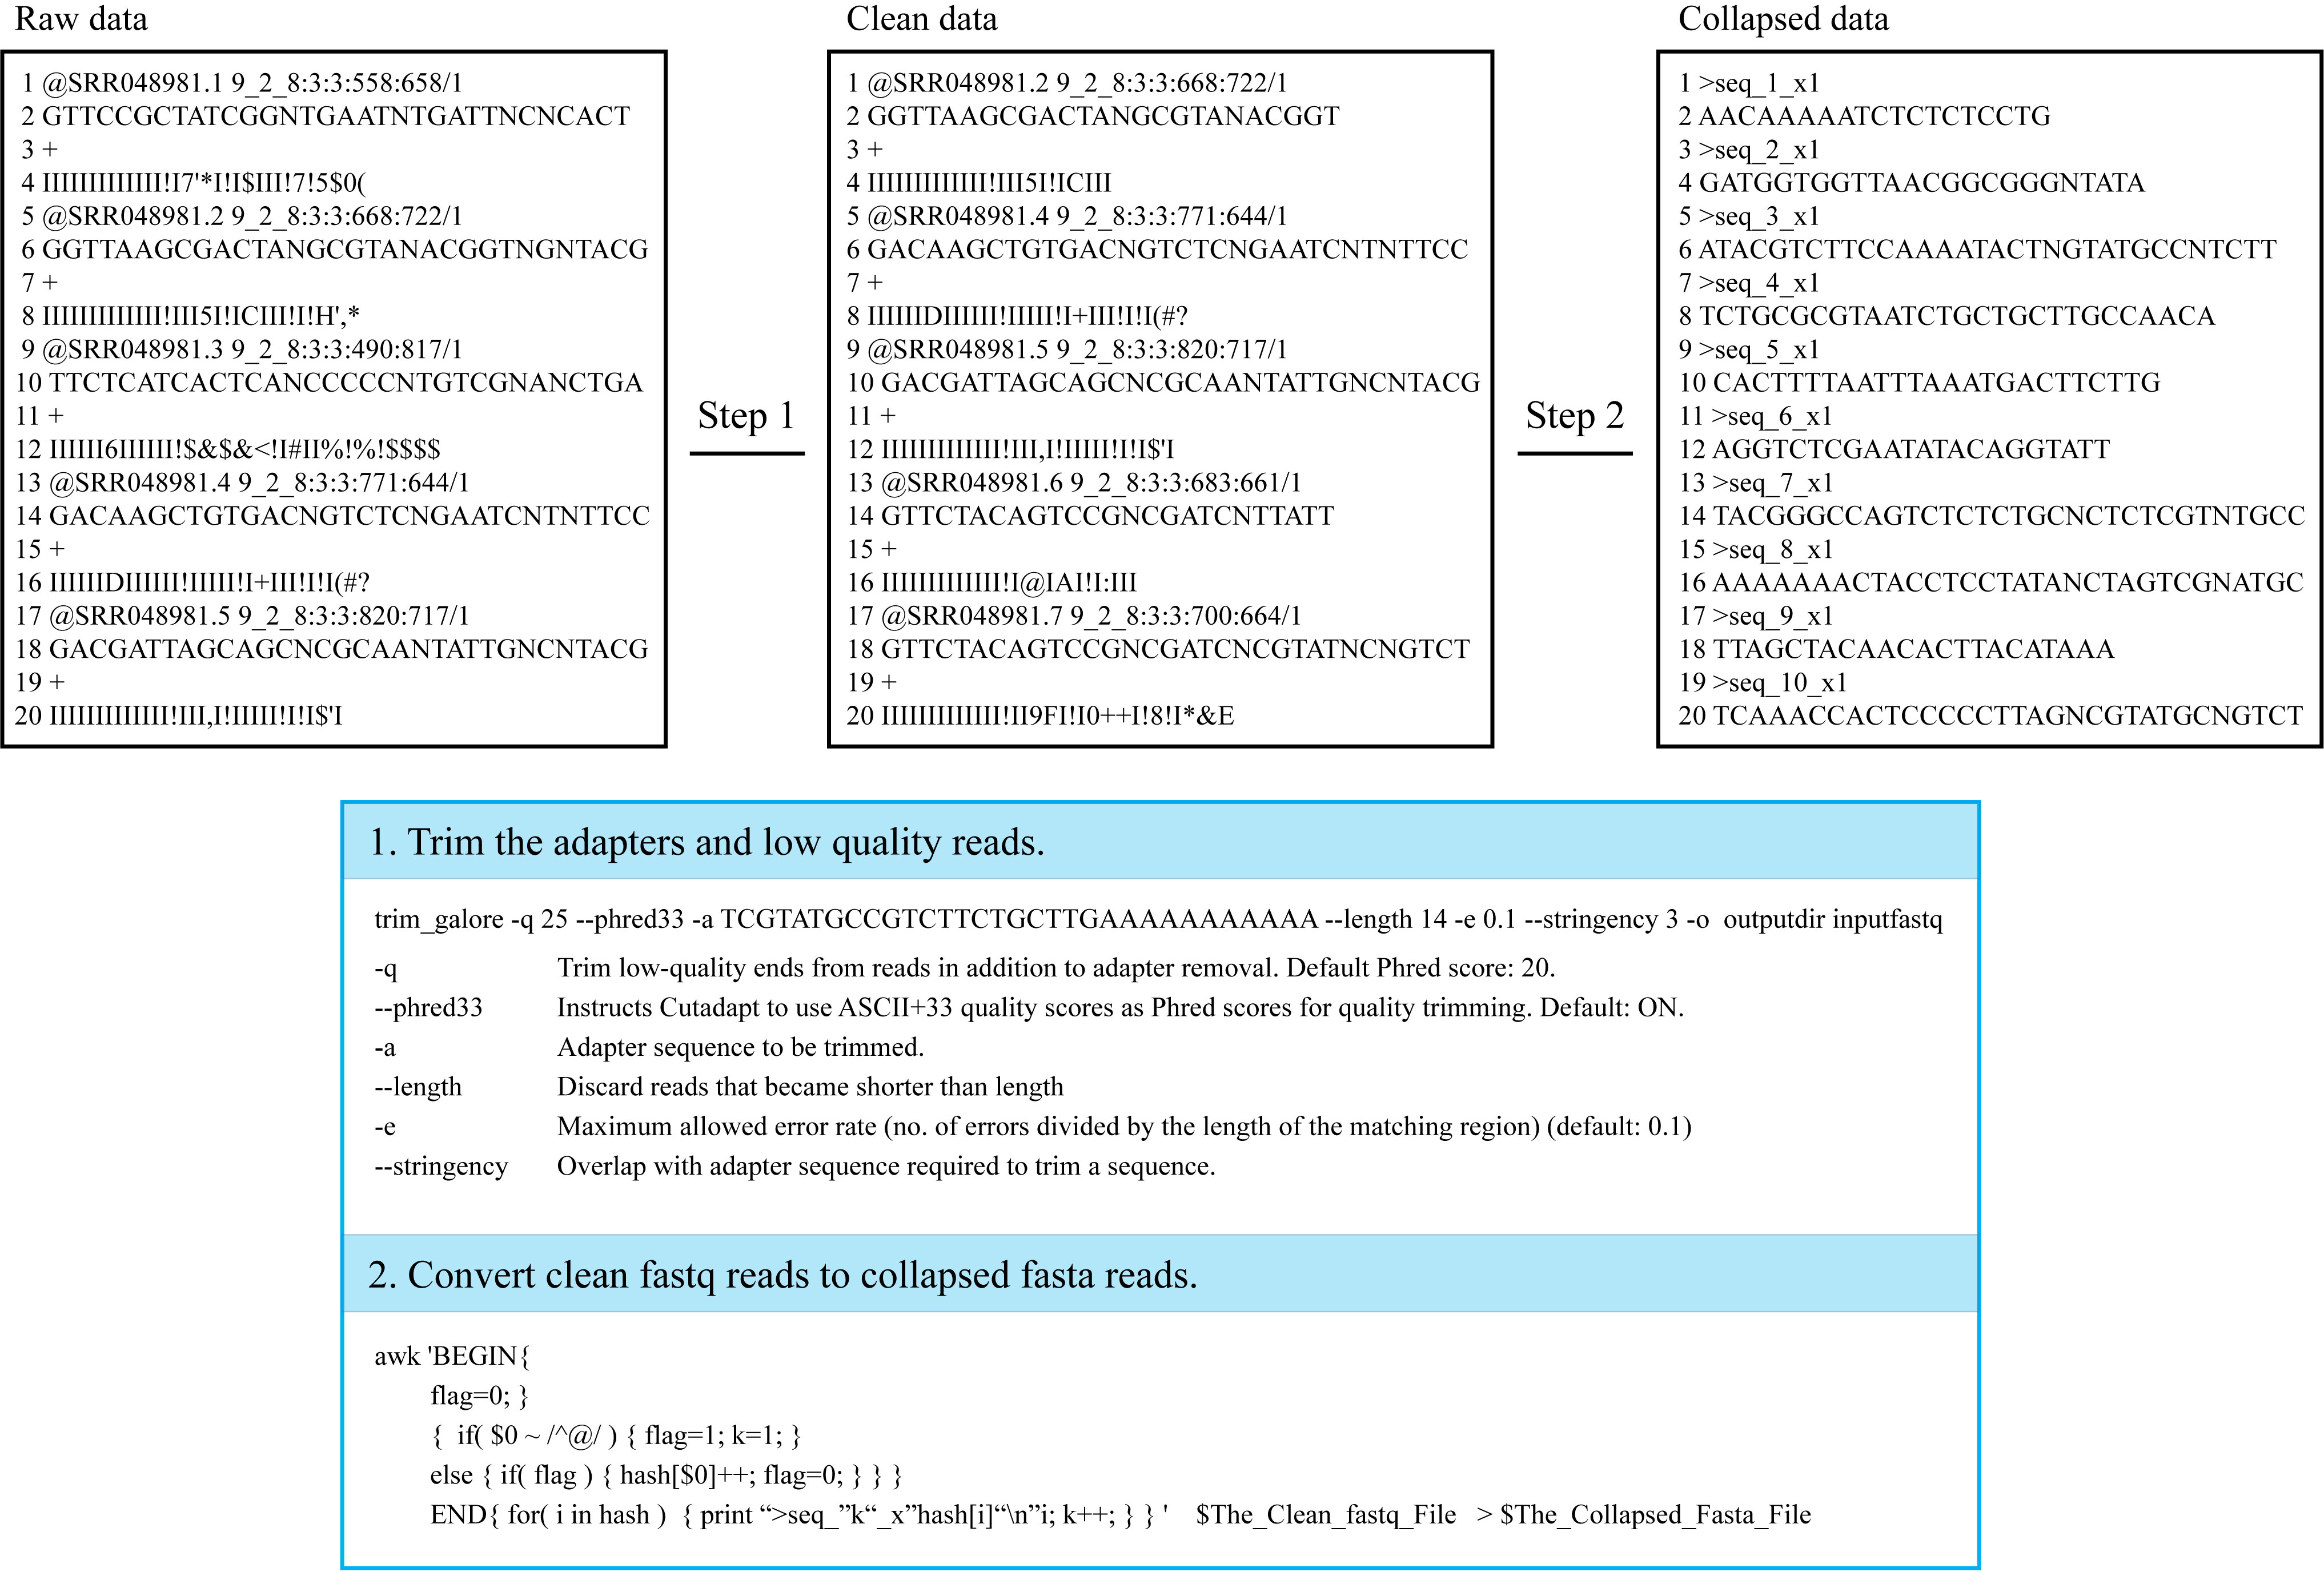
For the purpose of decreasing the time-consuming of online tools, users should firstly trim the input data to collapsed fasta format in the following steps.
Step 1: Users can filter the adapters and low quality reads from raw fastq data by Trim_galore or some other software;
Step 2: Then, users can convert the clean fastq reads to collapsed fasta format. The conversion can be done by the following code in Linux;
Details:
¶ "FASTA": FASTA is a plain-text format for representing DNA, RNA or protein sequences. Every nucleotide or amino acid is represented by single-letter. For details on FASTA format, please see FASTA Format in Wikipedia;
¶ "Input format": Collapsed fasta reads are required as input format, and the reads should be named by unique tags (e.g. “>seq_1_x1”. The name includes three parts, first part is “>seq”, the second part “1” represent the unique id, the last “x1” represent the count number of read, and “_” acts as a connector in the tag);
¶ "Convert code in Linux": The raw data can be trimmed by trim_galore software. trim_galore -q 25 --phred33 -a $Adapter_Sequence --length 14 -e 0.1 --stringency 3 -o $Output_Dir $Raw_Fastq_Data.
The clean fastq reads can be converted by the code in Linux: awk 'BEGIN{ flag=0 }{ if($0~/^@/) { flag=1; k=1; } else{ if(flag) { hash[$0]++; flag=0; } } } END{ for(i in hash) { print ">seq_"k"_x"hash[i]"\n"i; k++; } }' $The_Clean_Fastq_File >$The_Collapsed_Fasta_File.
tsRFinder
The "tsRFinder" module provides a comprehensive means of identifying tsRNA molecules from small-RNA seq data. Here, we give one examples to show how to use the module to explore the tsRNA molecules and the detailed result page.
Step 1: For tsRFinder, only collapsed FASTA fromat for RNA sequences is supported. There are mainly two ways to input your sequence;
Step 2: Parameters such as the number of allowed mismatches, tsRNA length range, and p-value can be specified by users to narrow the tsRNAs prediction results;
Step 3: It might take some time for tsRFinder to identify the tsRNAs. Please wait for a minute. On the "Predict Results" page, there are several important components of identified tsRNAs.
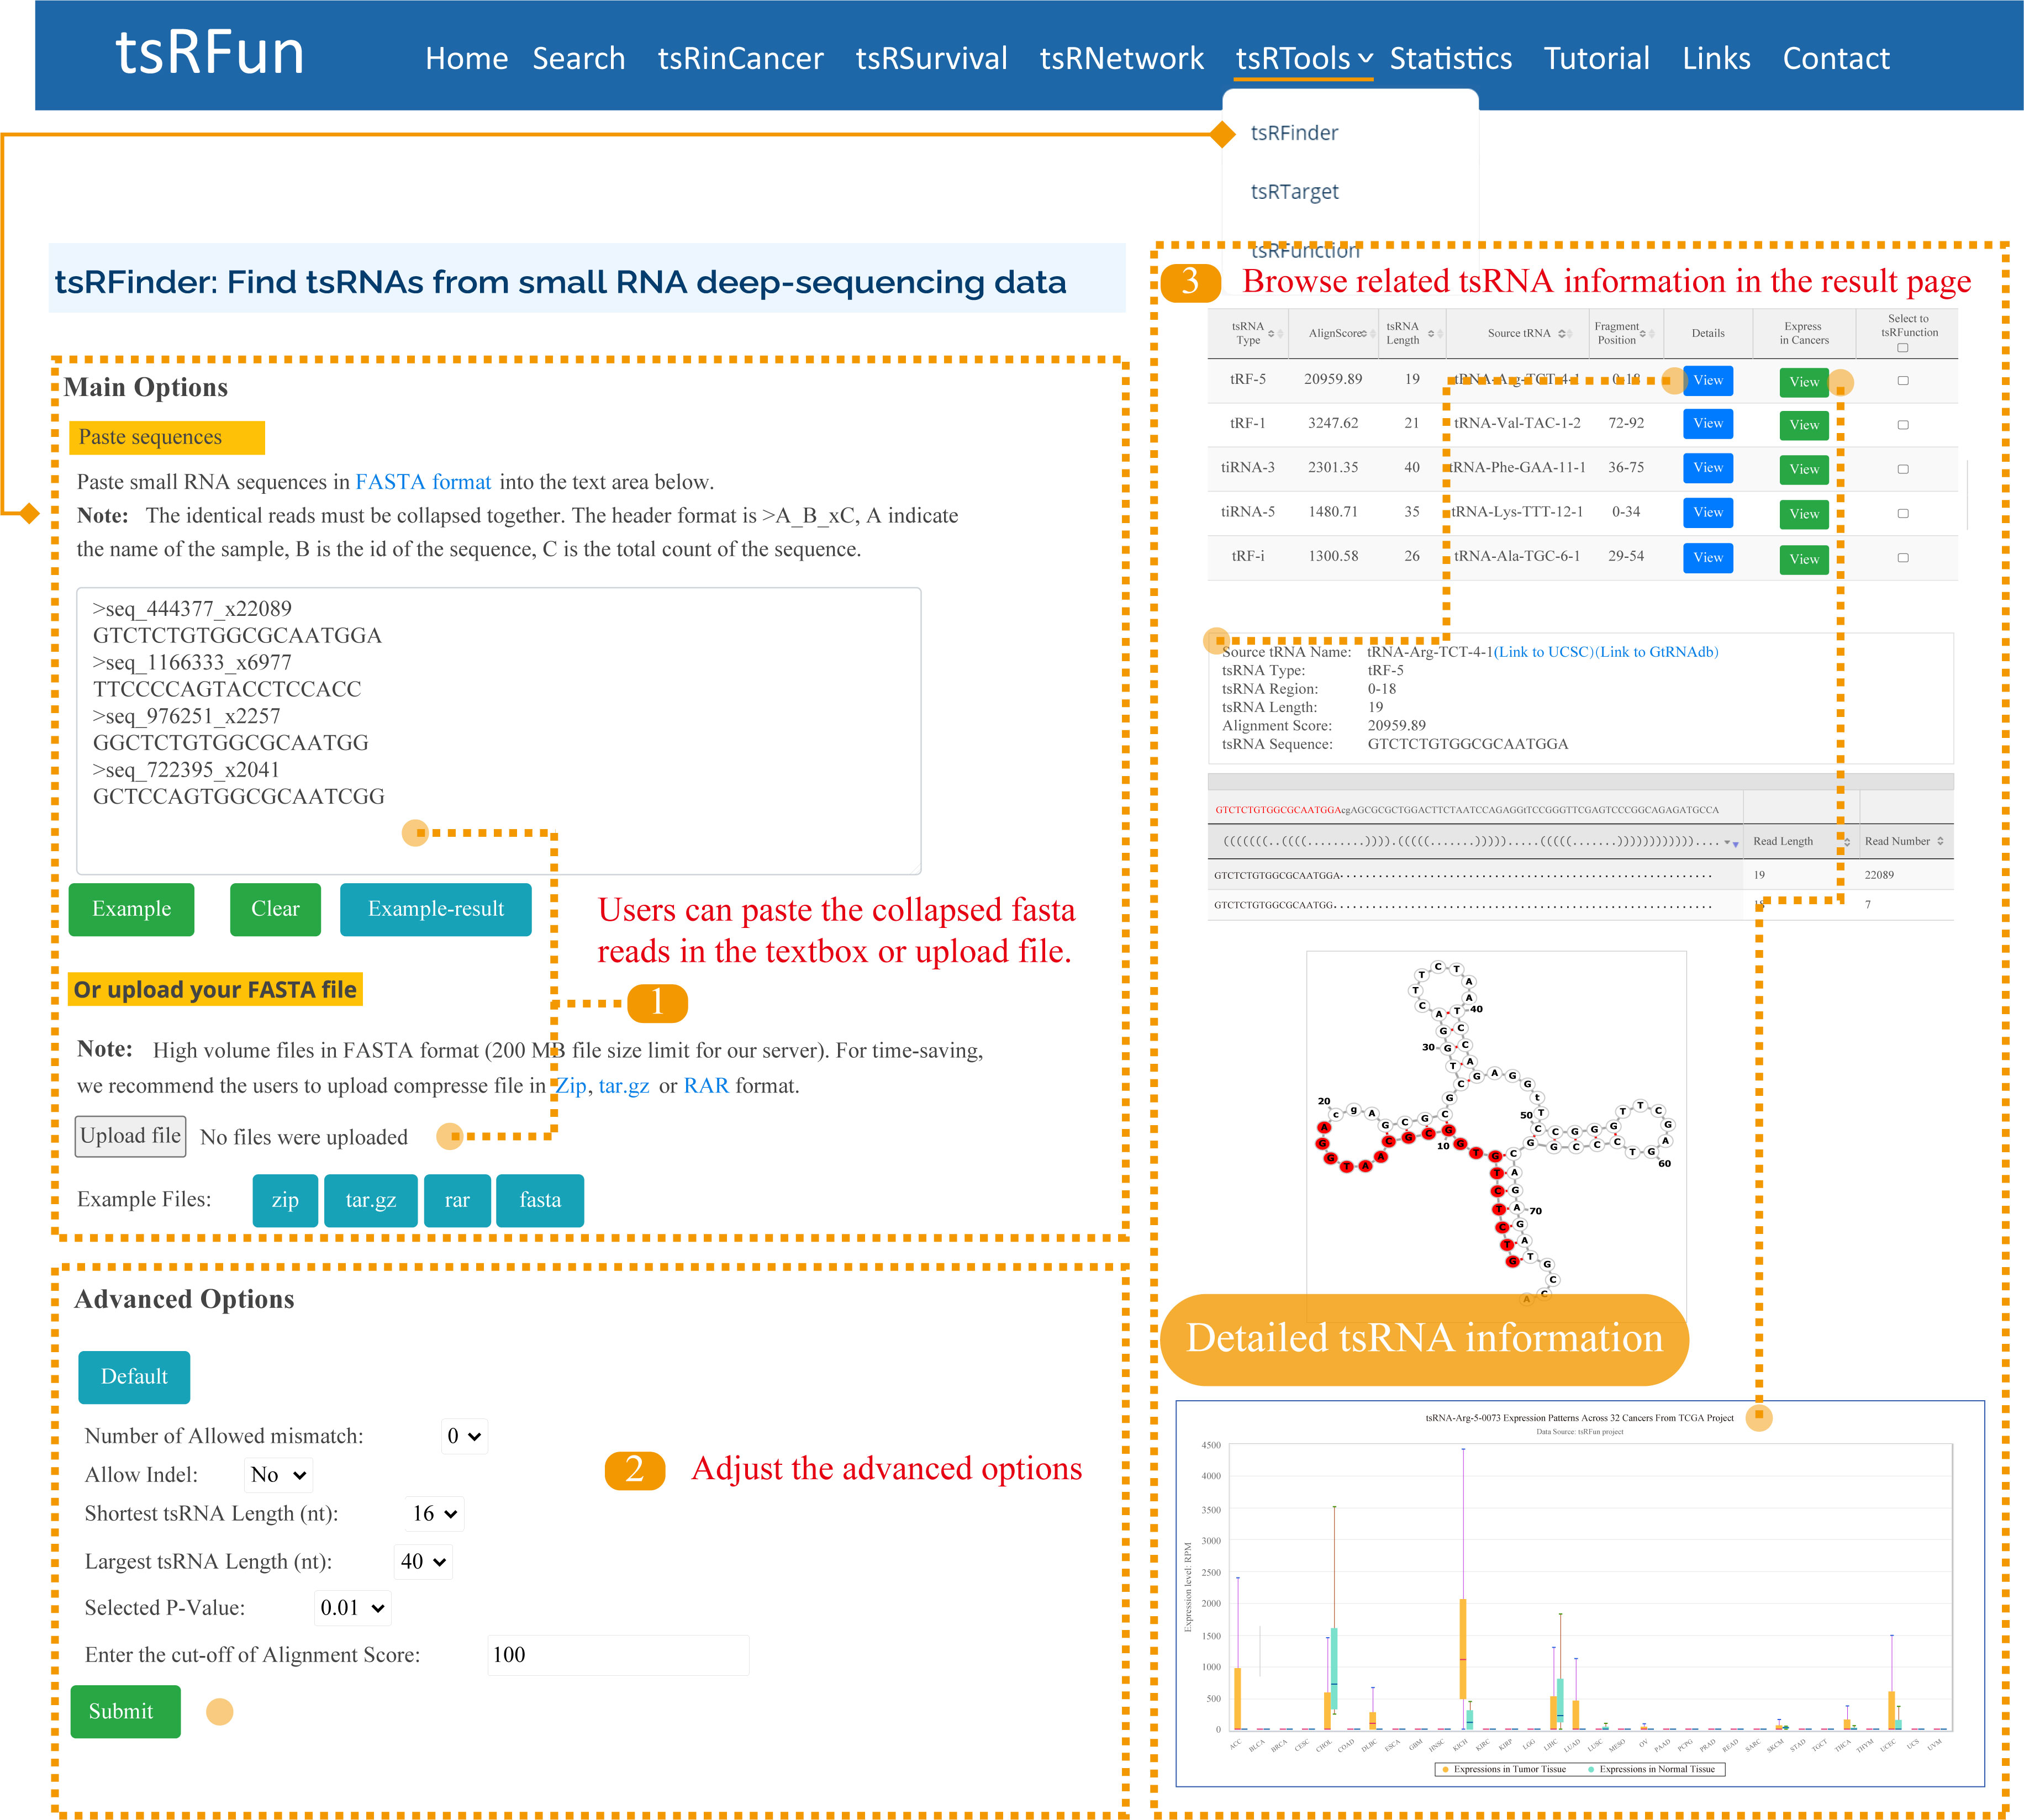
Advanced Options of tsRFinder:
¶ "Number of Allowed mismatch": The maximum number of mismatches allowed for mapping the small-RNA reads onto the tRNA. 0 by default, ranging from 0 - 2.
¶ "Indel": "Indel" means insertion or deletion of nucleotide(s). This parameter sets the maximum number of nucleotide insertions or deletions allowed for mapping the small-RNA reads onto the tRNA sequences.
¶ "Shortest tsRNA Length (nt)": Generally tRFs are of 18 nt in size and tiRNAs are of 35 nt. This parameter sets the minimum number of nucleotides. 16 by default, ranging from 16 - 40.
¶ "Largest tsRNA Length (nt)": Maximum length of the tsRNAs allowed to be regarded as tsRNA candidates. 40 by default, ranging from 28 - 40.
¶ "Selected P-value": 0.01 by default. Binomial test is used to evaluate the significance of the abandance of sequenced sRNAs distributed on each tRNA. In contiguous positions on the tRNA, reads with p-values less than 0.01 are regarded as tsRNA candidates.
RPM
1. Different sources of samples could vary in size and depth of sequencing. In order to normalize the samples for direct comparisons, the RPM method is adopted:

2. where C is the sum of reads mapped onto one particular position in the tsRNA, and NN is the sum of reads having been mapped onto the tRNA genes.
P-value
1. To perform the screening, it is first assumed that fragmented RNAs are randomly distributed along the entire pre-tRNA; that is, the RNAs are uniformly distributed across the entire length of pre-tRNA. According to this assumption, we could conclude that, of the entire length of tRNA, the probability of one small-RNA fragment mapped onto one particular position in the tRNA is

2. where L is the length (in nucleotide, nt) of the tRNA, and l is the length (in nucleotide, nt) of the small RNA fragment being mapped onto the tRNA.
3. Therefore, the probability of more than k (inclusive) small RNA fragments mapped onto the same position in the tRNA follows the Binomial distribution and the probability for this event is

4. where k is the observed counts of small RNA fragments mapped onto that particular position in the tRNA, and n is the total number of fragments mapped onto the entire tRNA.
5. If there are more than k (inclusive) small RNA fragments mapped onto one particular position in the tRNA, but the probability of this event occurring by chance (Eq. 2) is less than 1% (referred to the p-value, and can be adjusted to your satisfaction), then we could conclude that the assumption above is false (with 99% confidence, by default); i.e., this event does not occur by chance.
6. Note, however, that generally tsRNA is of more than 16 nt in length. To take this fact into consideration, we should ensure that the tsRNA candidate matches with tRNA sequence for consecutive more than 16 nt. (Mismatches, indels are allowed.) This, in turn, corresponds to the requirements that there are at least 16 nt bases in consecutive position in tRNA (which matches with the candidate tsRNAs sequences) should have a p-values less than 1%.
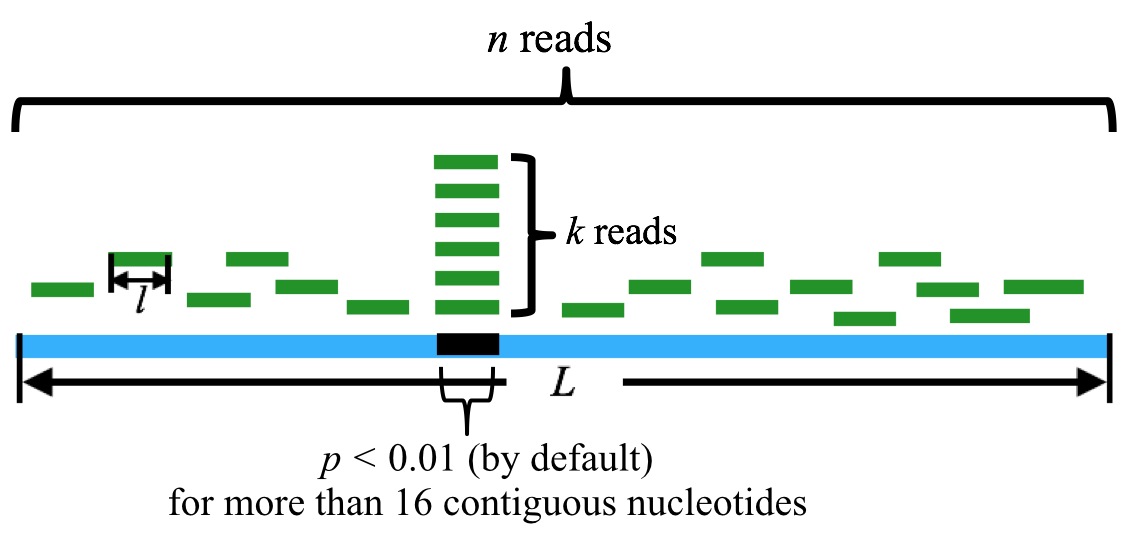
n is the sum of the reads mapped to the tRNA, k is the sum of the reads that are mapped to the particular position in the tRNA. l is the length of the reads, and L is the length of the tRNA. By default, a tsRNA candidate corresponds to more than 16 contiguous nucleotides with p-value(s) less than 0.01.
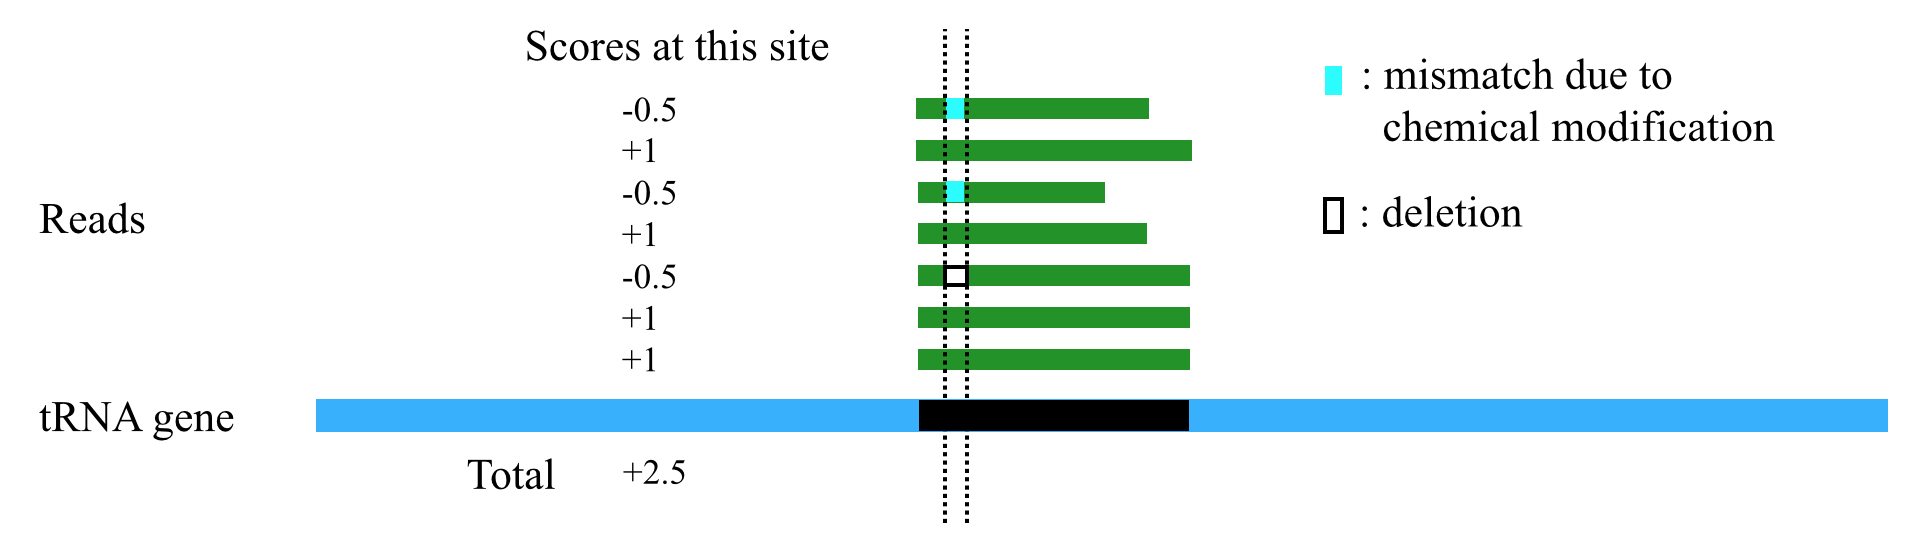
AlignScore
1. tsRFinder can use a scoring scheme to handle different types of mismatches / indels. When the reads are mapped to the tRNA gene sequences and a tsRNA region is obtained, tsRFinder scores each site of the tsRNA region according to the following rules (Table 1)
Table 1. The scoring scheme
| Cases on this site of a read | Score for this site of a read |
|---|---|
| Cases on this site of a read | Score for this site of a read |
| Perfect match | +1 |
| mismatch or indel of modification sites | -0.5 |
| mismatch or indel on other sites | -1 |
2. After each site of the tsRNA region is scored, tsRFinder sums up the scores to get a total score. To eliminate the effect of length on the total score (the longer the region, usually the higher the total score), the total score is divided by the length of the tsRNA region to get the alignment score for this region. By default, tsRFinder outputs only regions with alignment scores greater than 100 (this threshold can be set by users in the parameter option lists).
tsRTarget
The "tsRTarget" module shows the potential canonical and non-canonical tsRNA-mRNA interactions based on CLIP-Seq and CLASH/CLEAR data. Here, we give one examples to show how to use the module to explore the tsRNA molecules and the detailed result page.
Step 1: For CLIP-Seq data, we clustered the unique CLIP reads overlapped in genome reference, and ranked them by peak high. The observed peak height can reflect the binding affinity and RNA abundance.
Step 2: For CLASH/CLEAR data, we used duplex reads mapping for ultra-short RNA strands to multi references, and allow the 1-2 mismatches because the potential contaminants during the crosslinking.
Step 3: It might take some time for tsRTarget to predict the interaction among tsRNA, miRNA, and target. Please wait for a minute. On the "Predict Results" page, there are several important components.
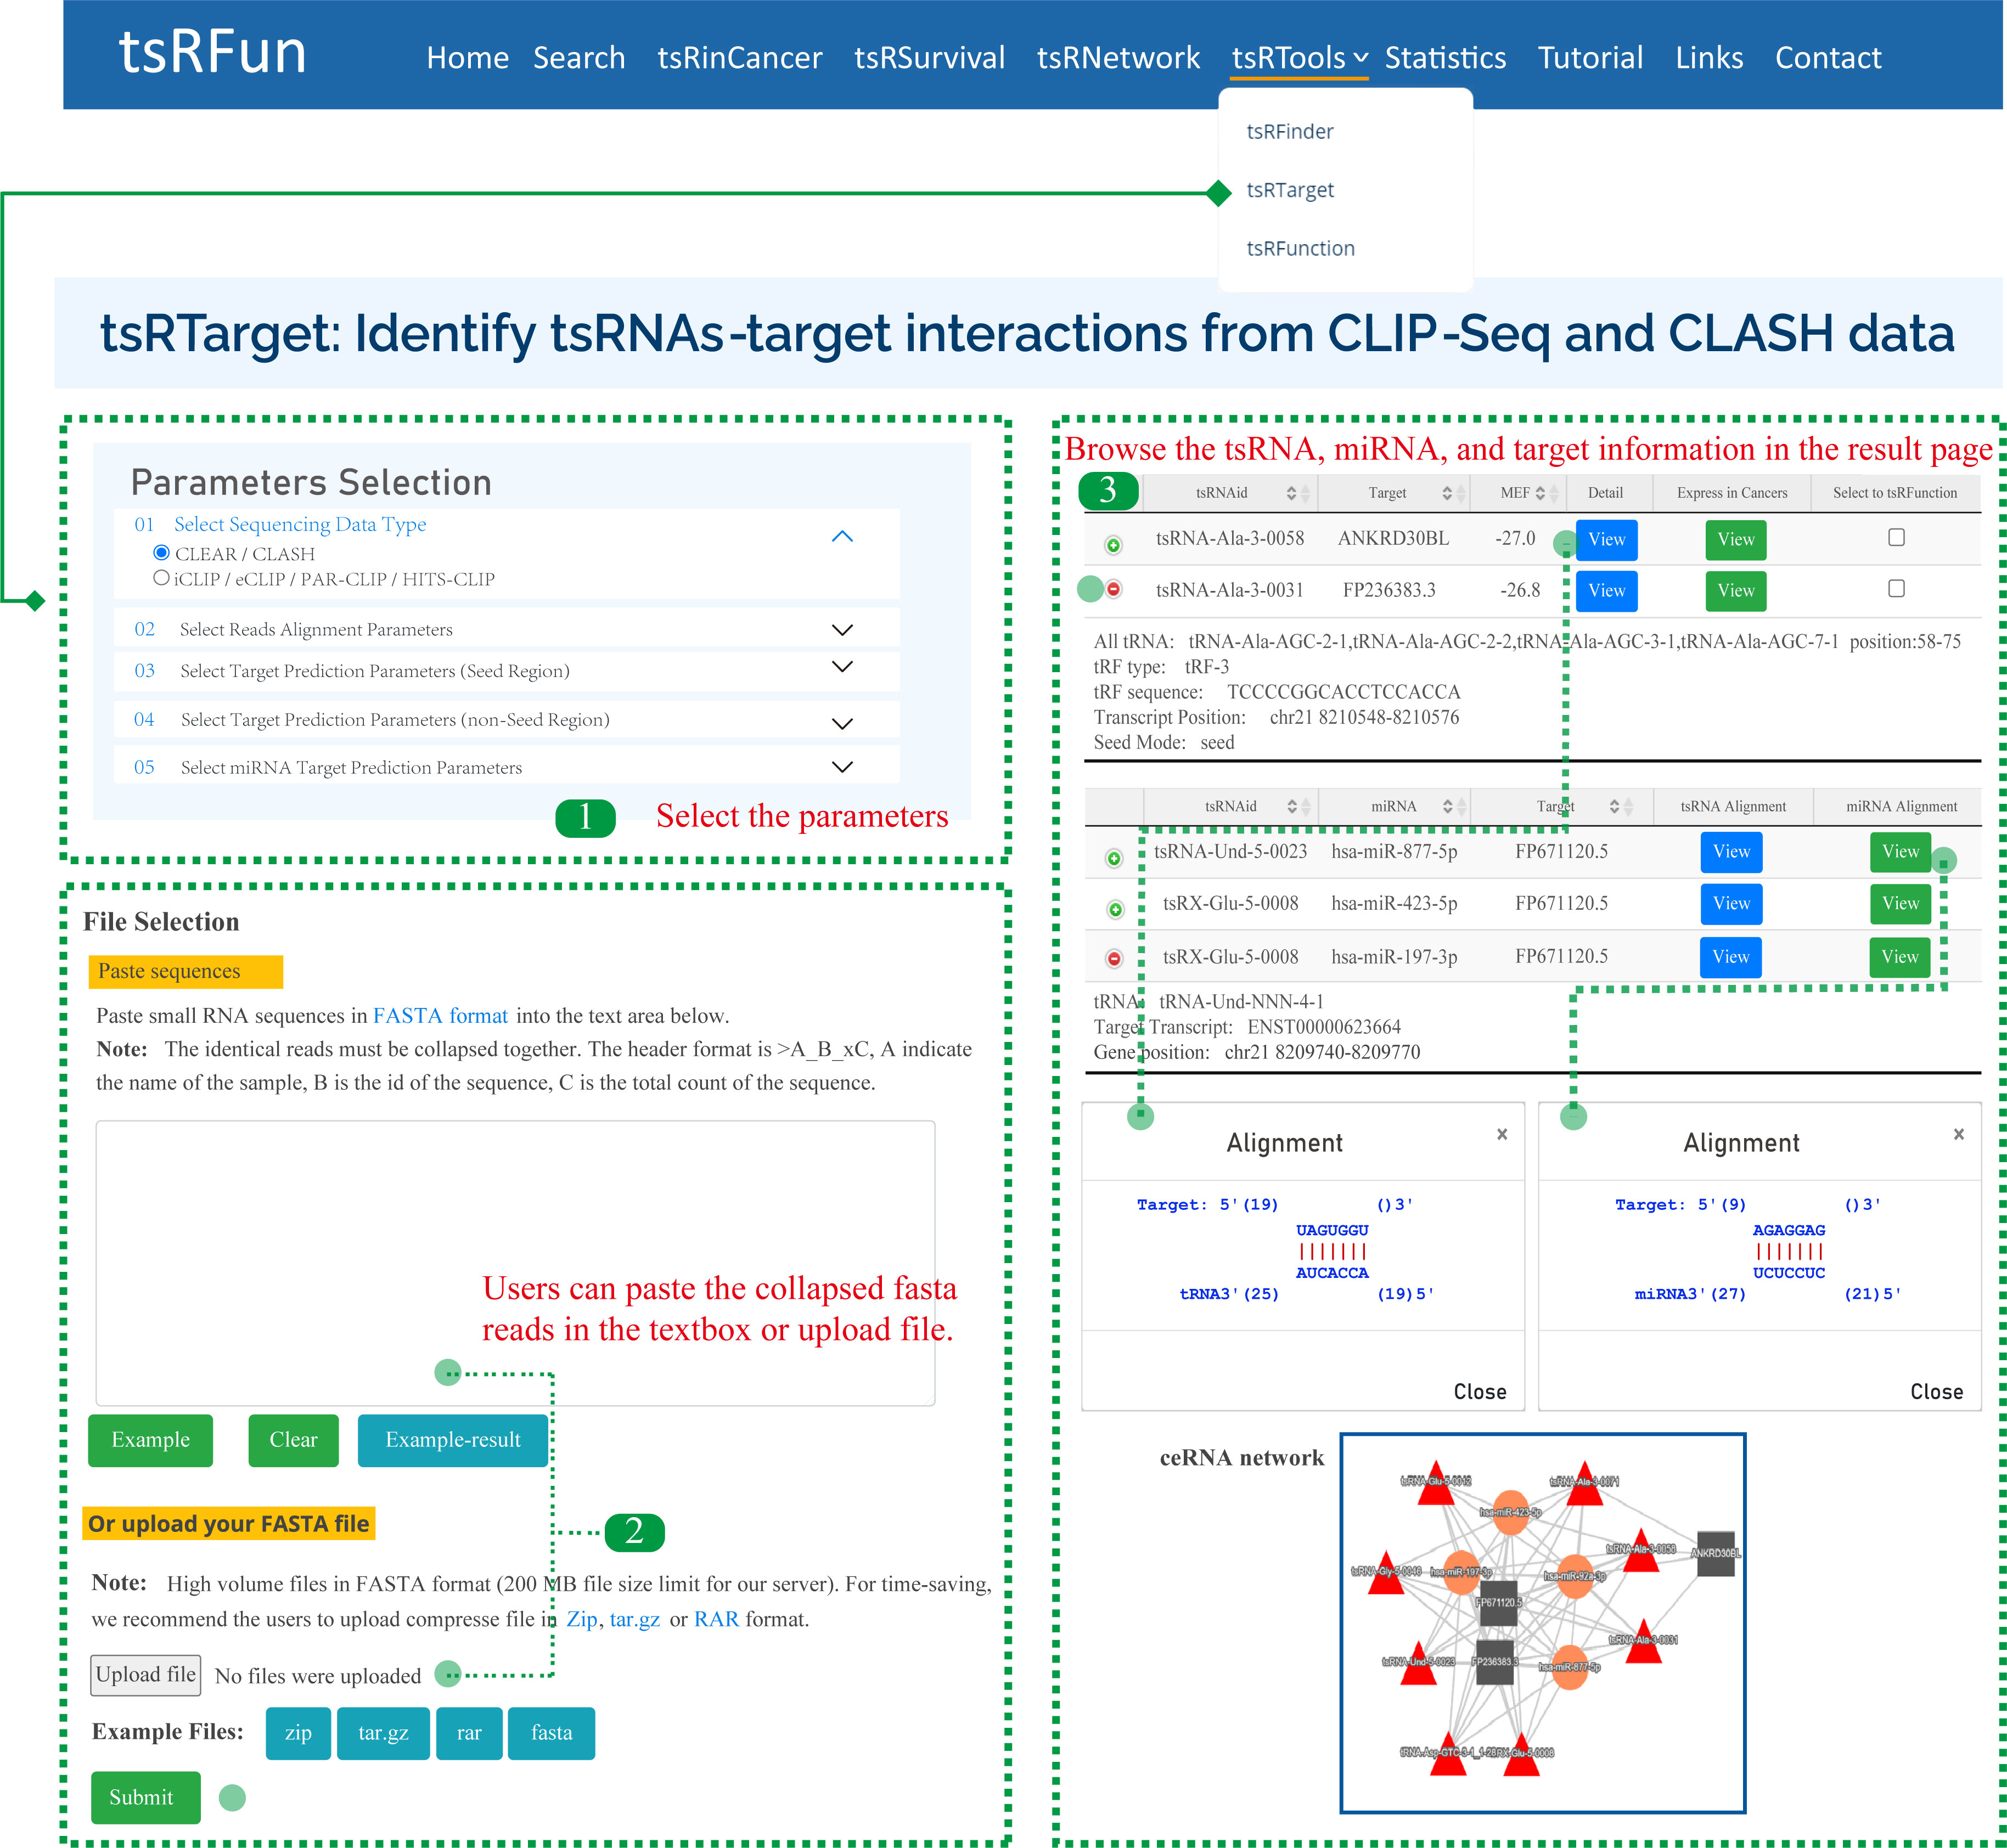
Parameters of tsRTarget:
¶ "Sequencing Data Type": CLEAR / CLASH or iCLIP / eCLIP / PAR-CLIP / HITS-CLIP, tsRTarget will adjust the alignment pattern according to the choosed data type.
¶ "Reads Alignment Parameters": Including Number of Allowed mismatch, Shortest tsRNA Length (nt), Shortest Target Length (nt), and Collapse PCR duplicates
¶ "Target Prediction Parameters (Seed Region)": For seed-based canonical target pair-alignment, users can select the location of seed rigion and the min free energy(MFE).
¶ "Target Prediction Parameters (non-Seed Region)": For noncanonical binding pattern, users can select the match length and gap open.
¶ "miRNA Target Prediction Parameters": tsRTarget supports the identification of miRNAs, and the alignment parameters of miRNA are similar to tsRNA molecules.
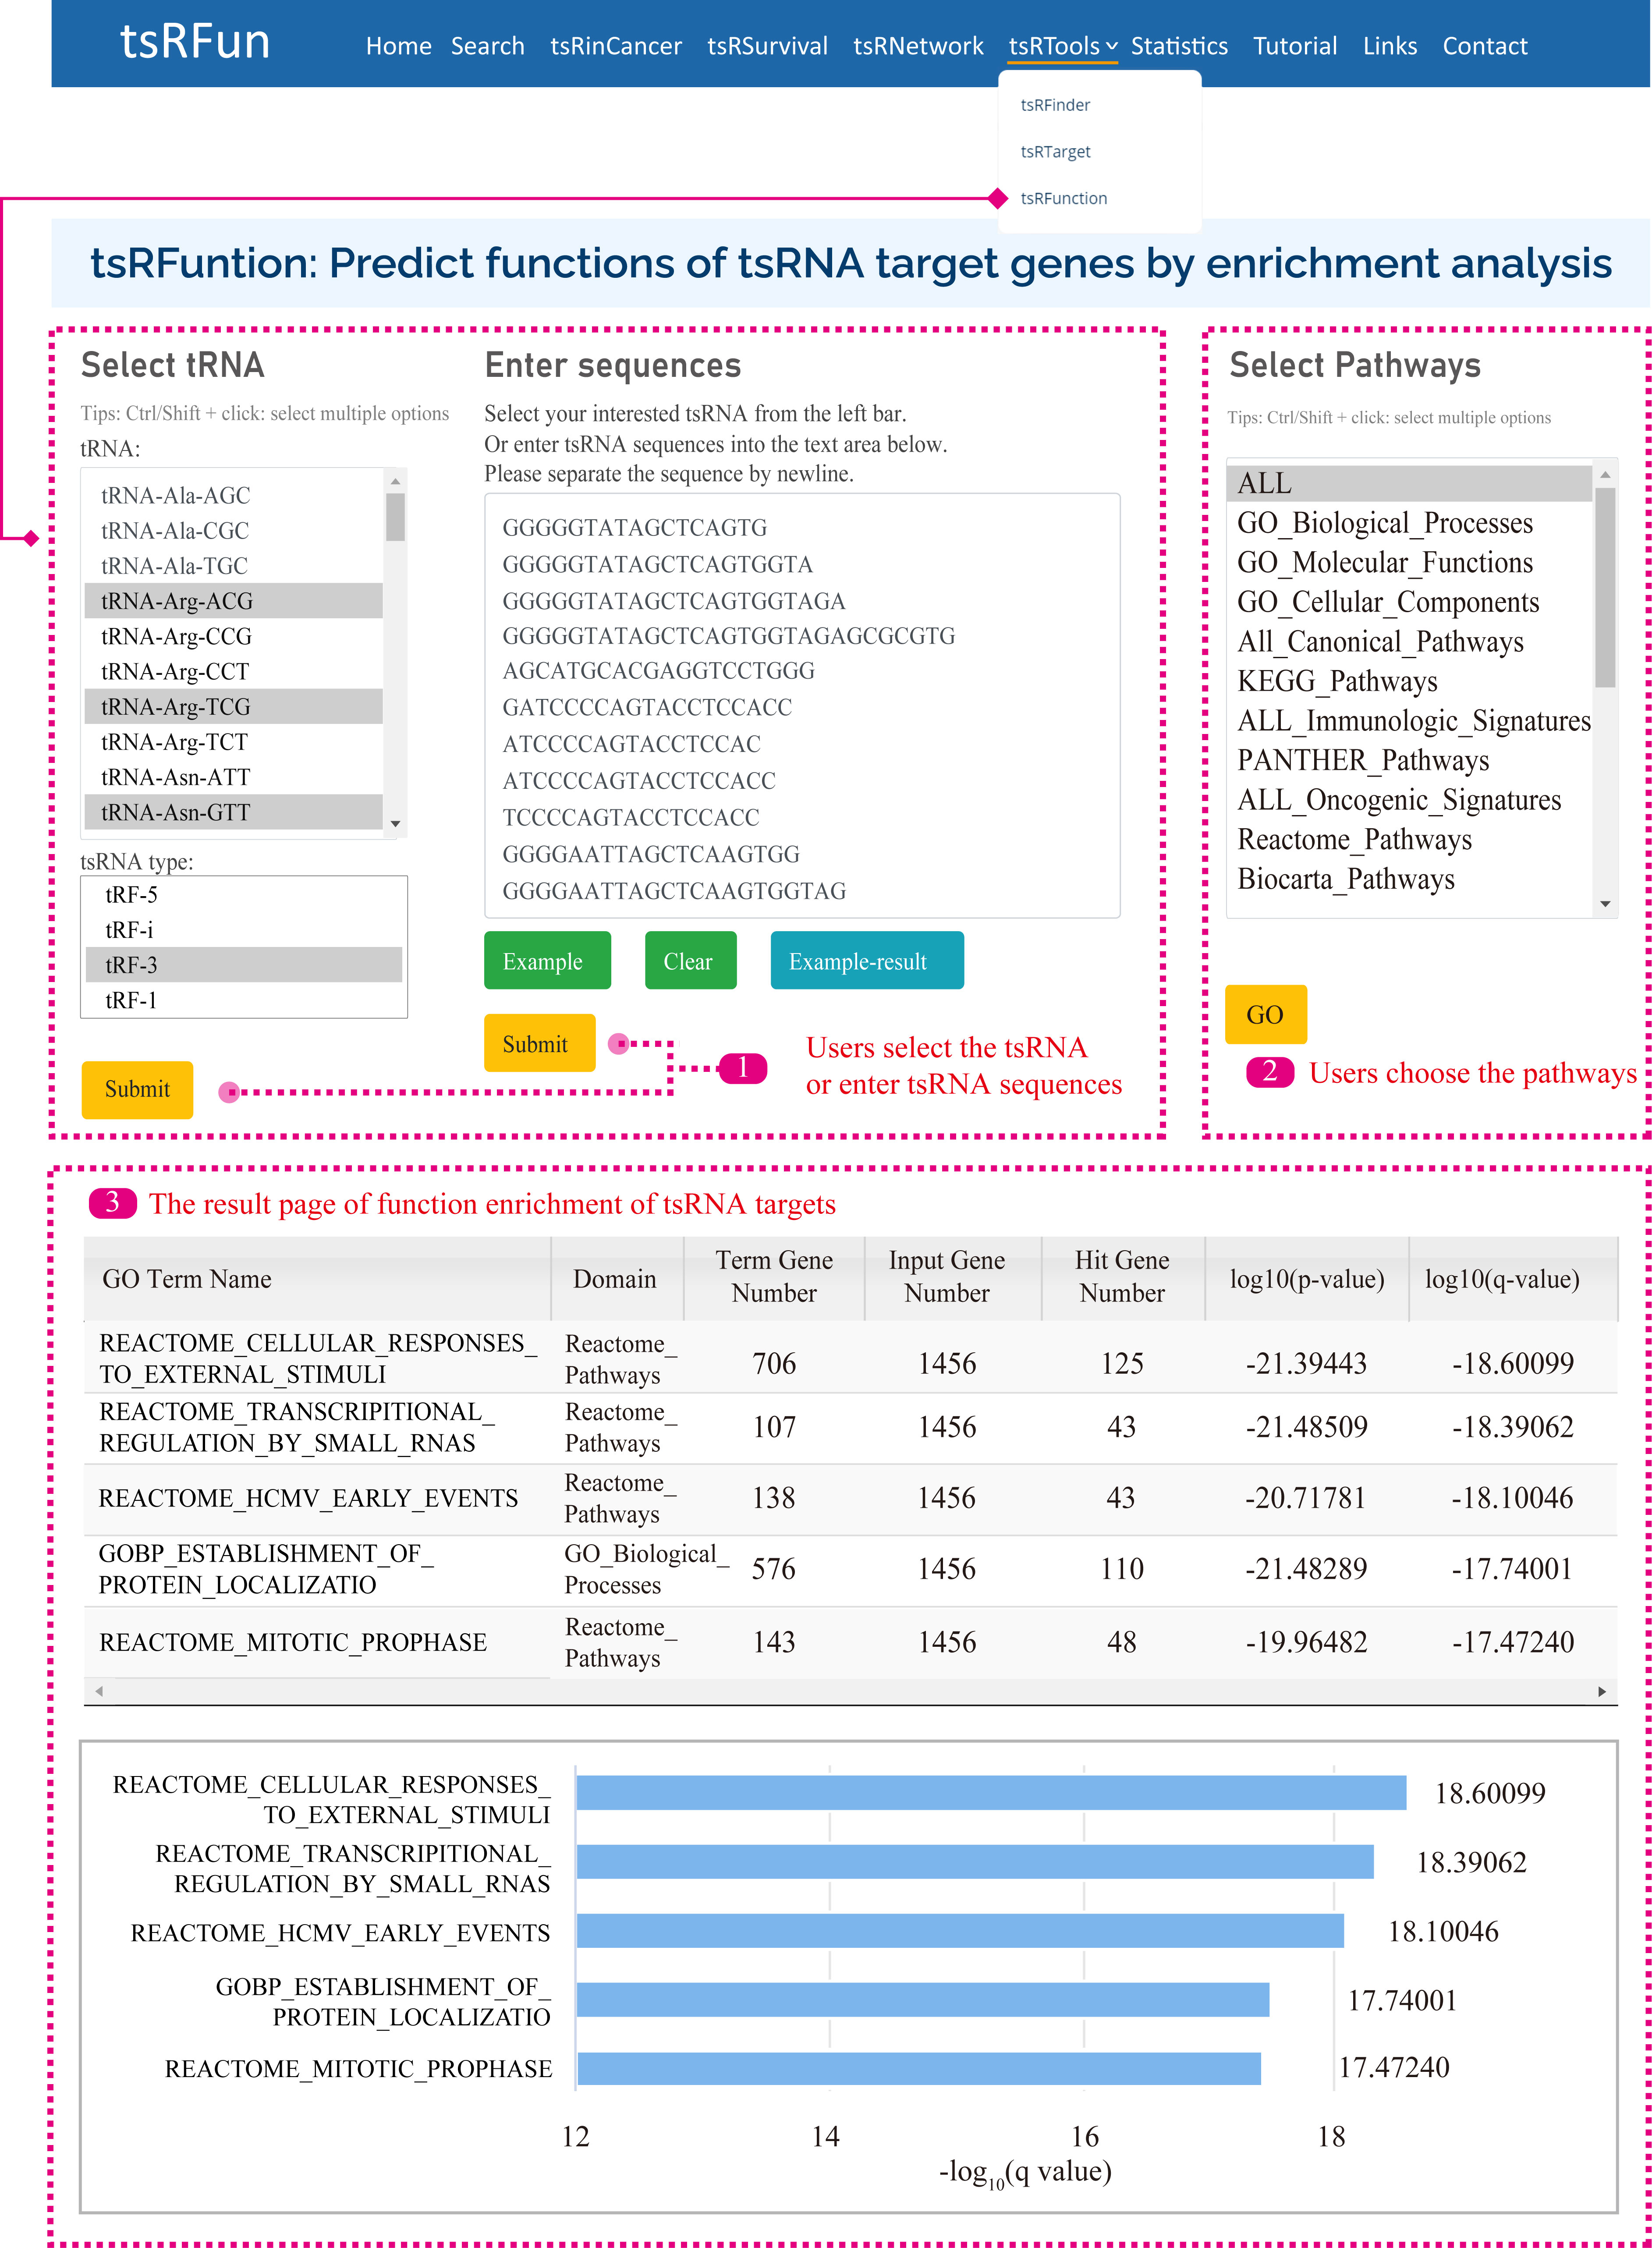
tsRFunction
The "tsRFunction" integrates the predicted tsRNA-target interaction network information from CLASH / CLEAR and CLIP data, and users can select a variety of tsRNA molecules for following functional enrichment analysis.
Users can query the function of tsRNAs through two ways: (1) Select specific tsRNA and tsRNA types; (2) Input specific tsRNA sequences.
After that, we search the database for the corresponding tsRNAs according to the user's query content, and then obtain the enrichment results of tsRNA targets in 15 Gene Sets, such as GO, KEGG, Reactome Pathways, Panther Pathways, etc.