distribution of tissues in each species
distribution of samples in each type of tissues
distrubition of marker genes in each species
species total_protein_genes marker_proteins protein_ratio(%) total_lncRNAs marker_lncRNAs lncRNA_ratio(%) total_other_ncRNAs marker_other_ncRNAs other_ncRNAs_ratio(%)
Human199121563978.5405785513802390628.3002463424681361814.65905
Mouse220581394563.2196935491088279.0799297322263516397.240998
Rat222501170.5258426973230007403130.175604
Zebrafish252865112.02088112259970.269334359387110.025833
Fly18397243213.2195466700-38401363.541667
Yeast505951710.2194109500-5100
exon number distribution statistics
transcript number distribution statistics
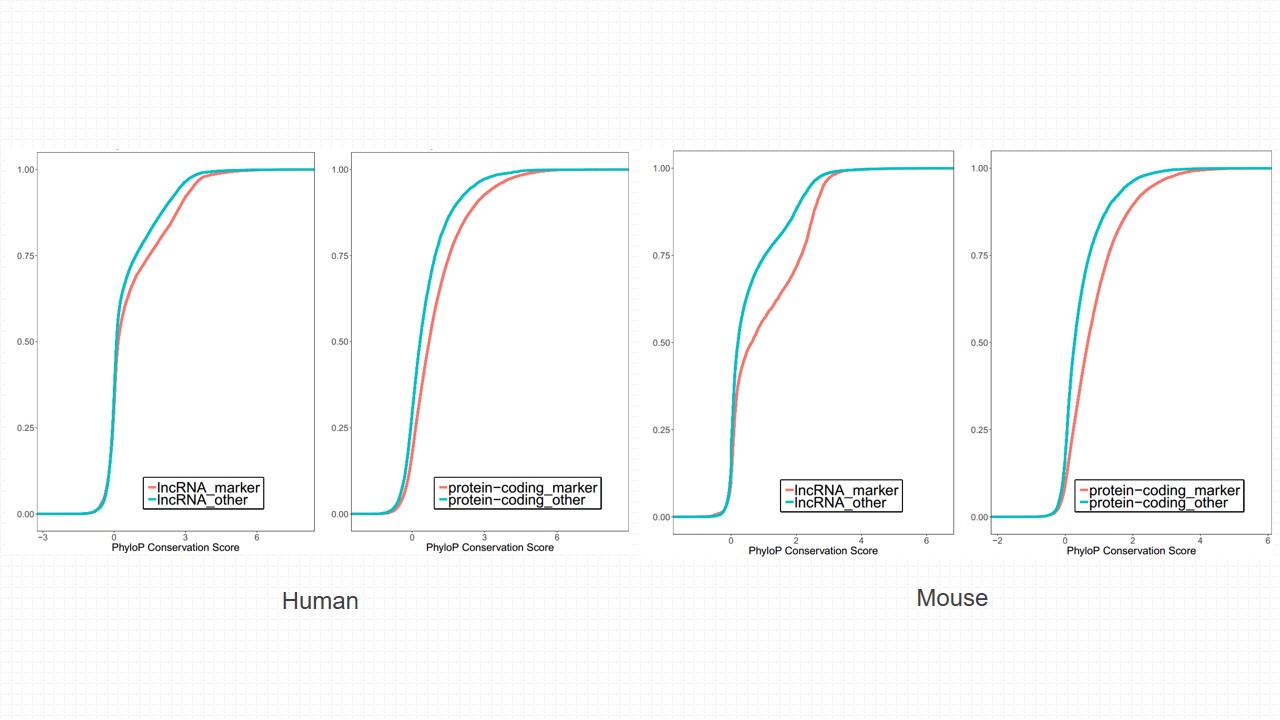
conservation analysis of different types of genes in human and mouse

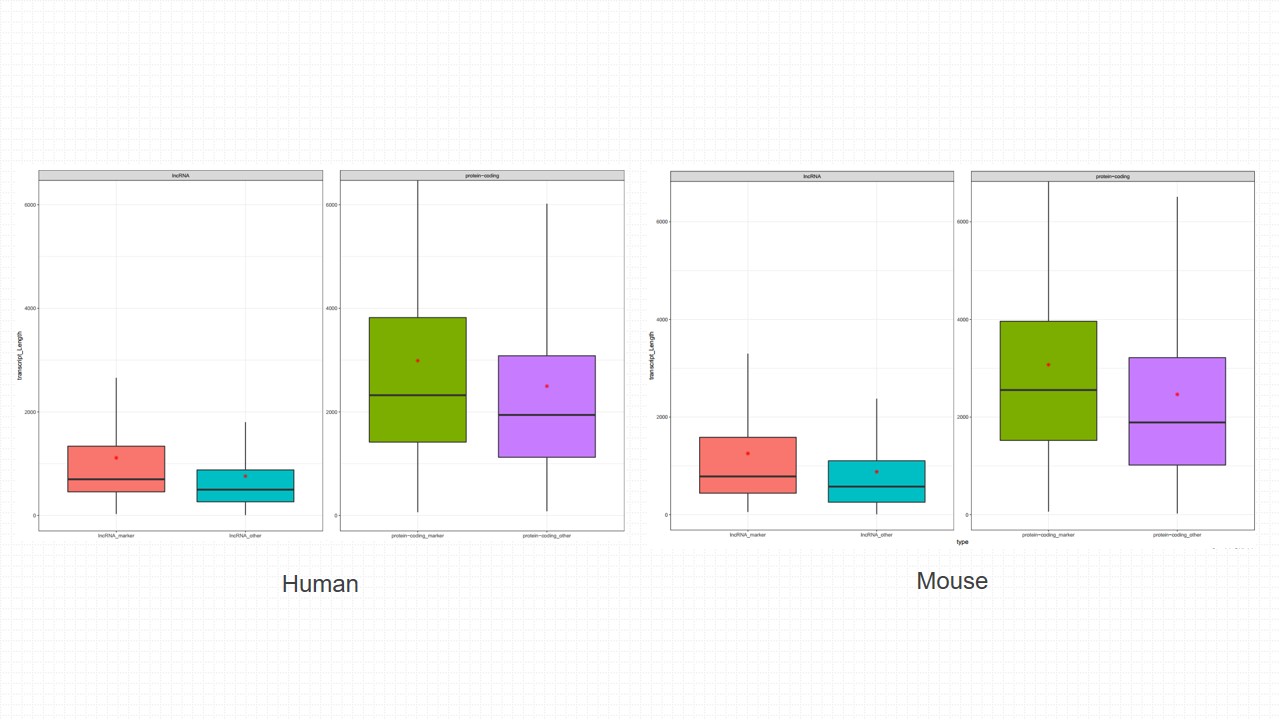
transcripts length distribution of different types of genes in human and mouse

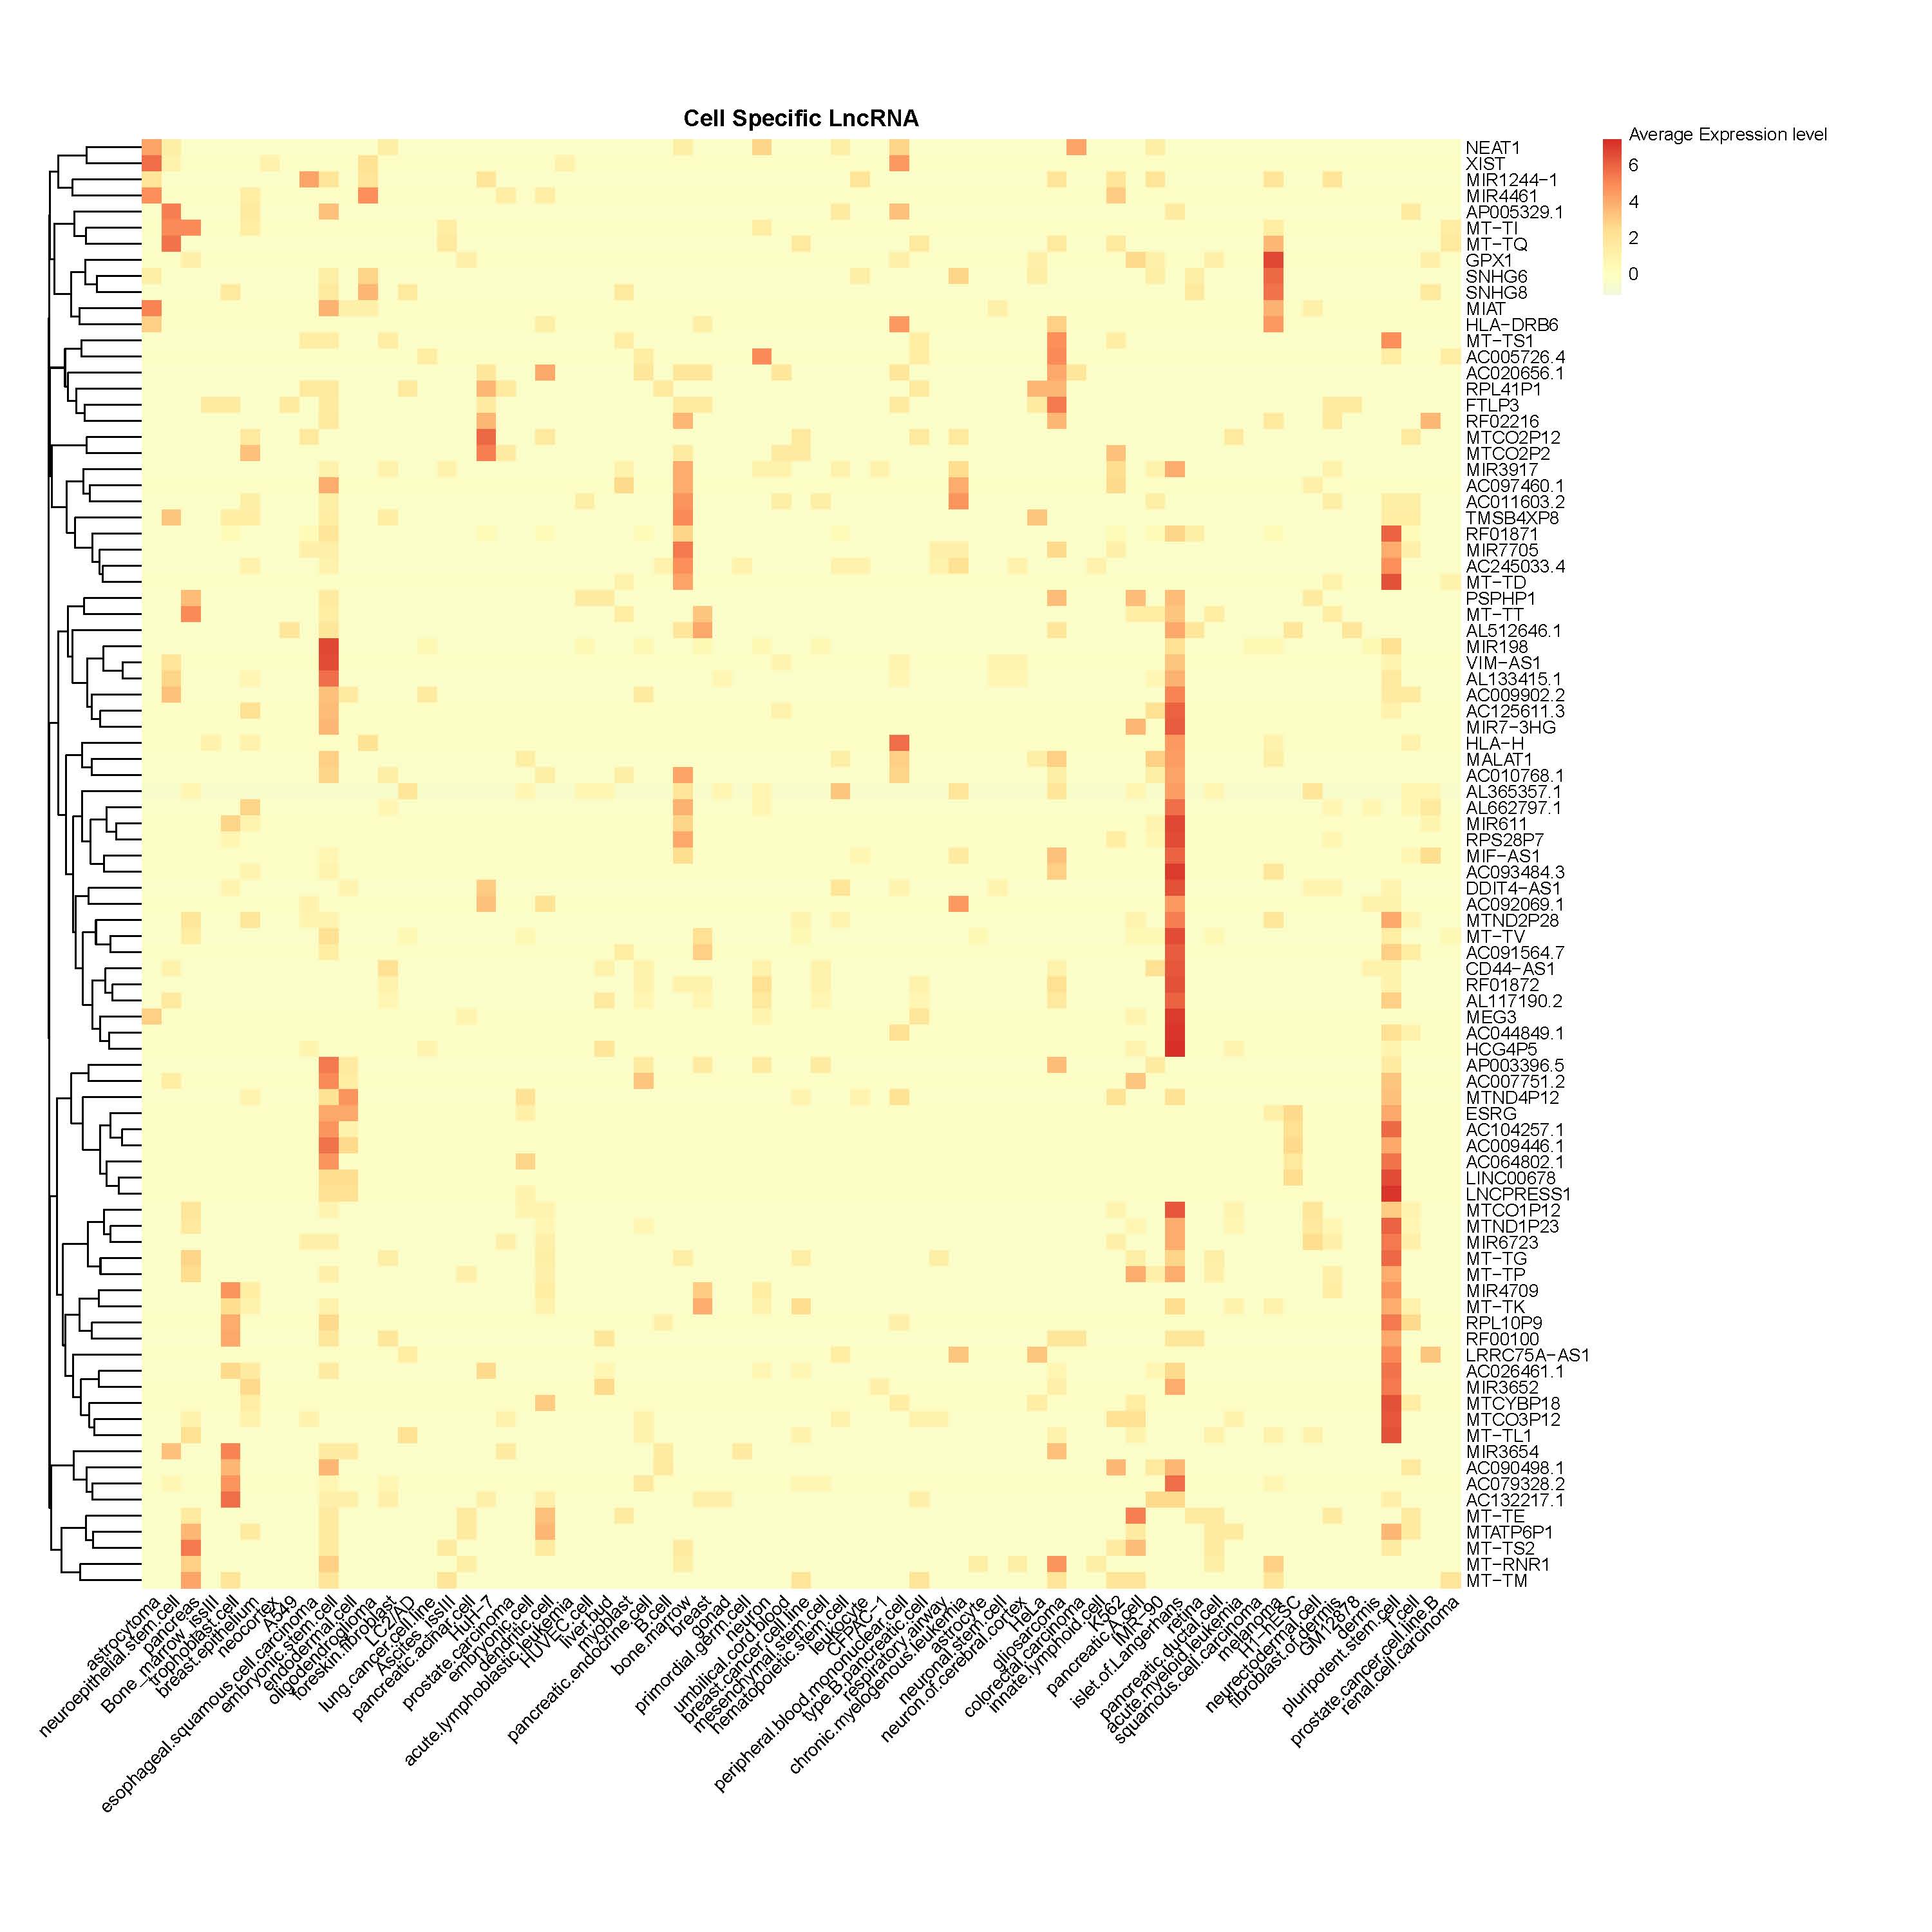
distribution of cell specific lncRNAs in each cell types