Search
The Search module provides comprehensive transcriptional and post-transcriptional regulatory features of pseudogenes from multiple datasets. The results table shows the amount of all kinds of supported experiment or evidence of expressed pseudoogenes. The usage is described as Fig. 1
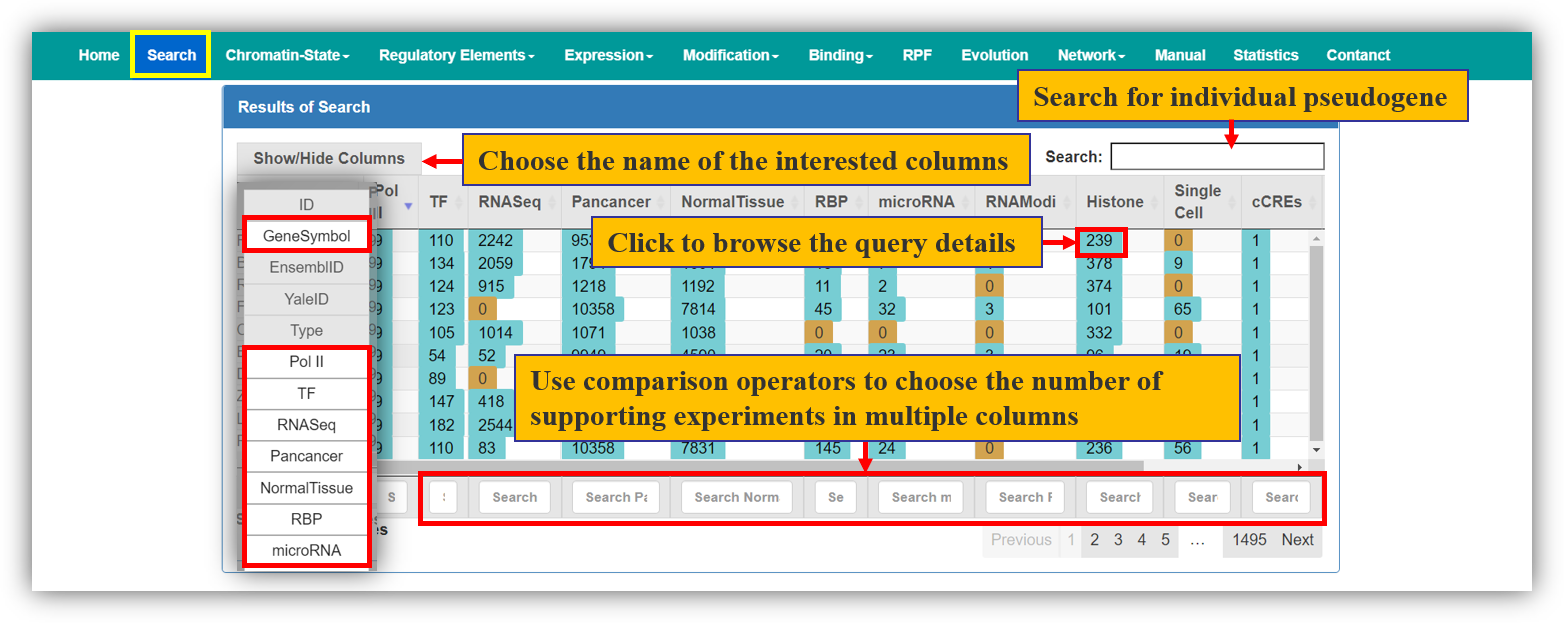
Fig. 1 The Usage of Search Module
Binding Modules
The Binding modules provide transcriptional and post-transcriptional regulatory features of pseudogenes, including Chromatin-State modules (DNaseI-Hypersensitivity sites and Chromatin-Activity), Regulatory Elements modules (active promoter regions of transcription factor, signals of active pol II and candidate cis-Regulatory Elements), Modification modules (Histone-Modification and RNA-Modification), Binding modules (interactions with RNA binding proteins and microRNAs). For the details information of every submodule, you can get from “About” table located on the bottom of each page. Here we take active promoters and microRNA bindings as examples to illustrate these modules (Fig. 2, Fig. 3).
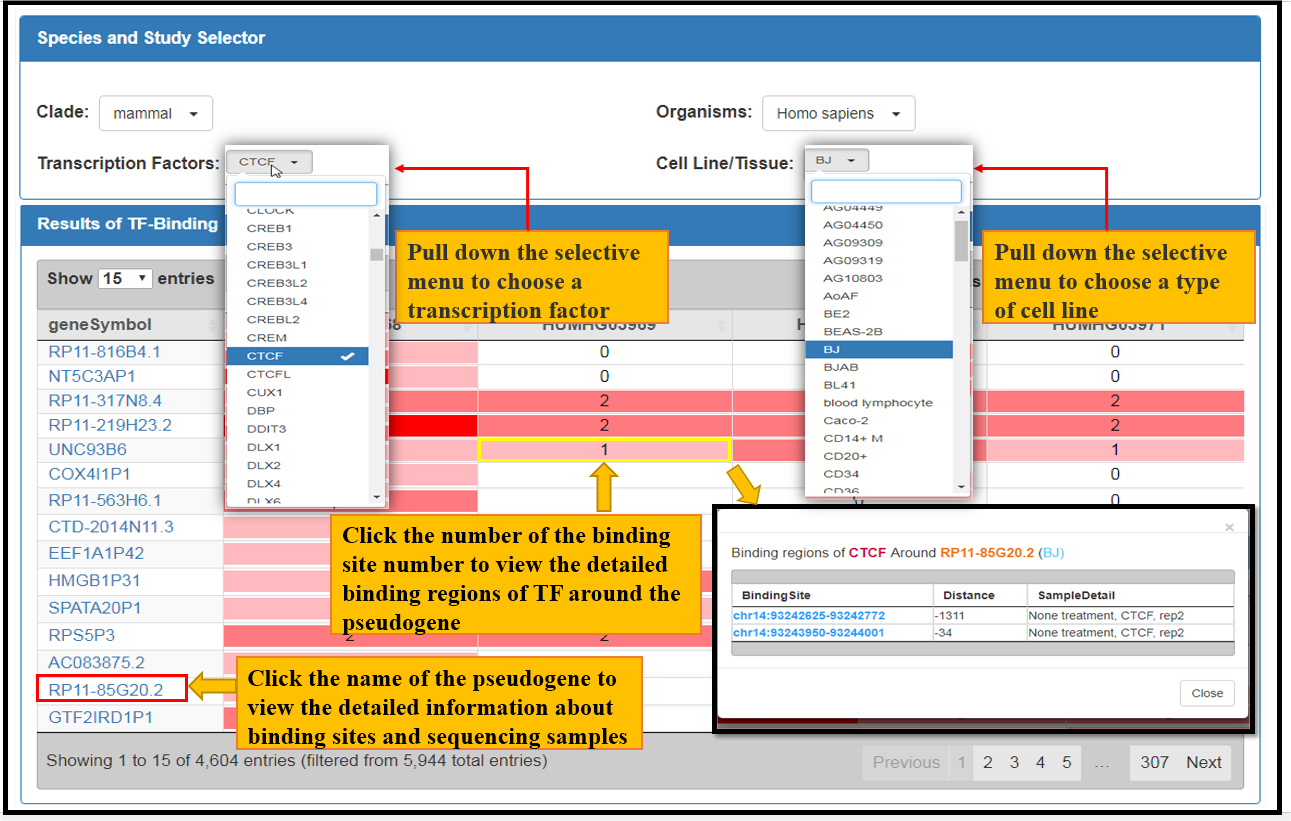
Fig. 2 The facets of CTCF Bindings in BJ Cell Line
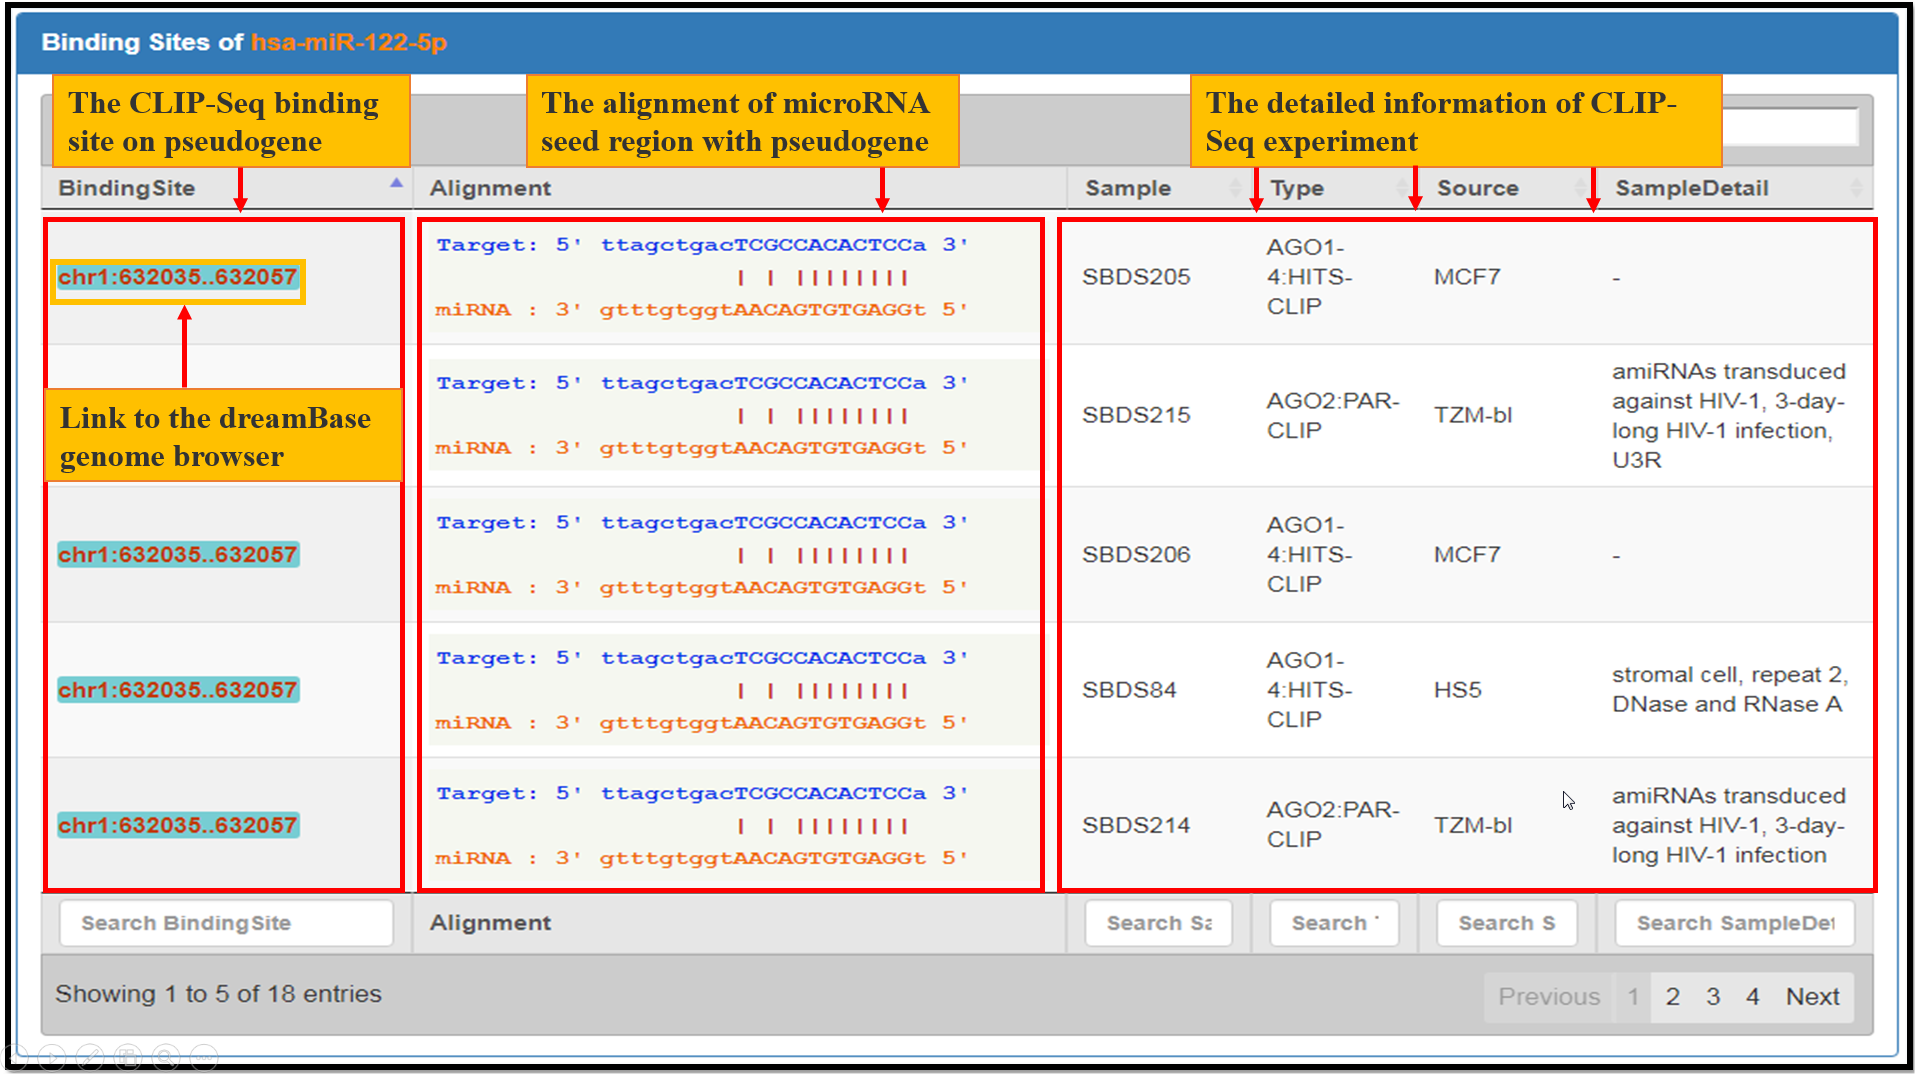
Fig. 3 The facets of microRNA Bindings
Expression
The Expression module provides expression landscapes of expressed pseudogenes across multiple types of cancer tissues, cell lines and normal tissues. There are 4 submodules in this module, including Pan-Cancer, Joint-Analysis, Normal-Tissue and Single-Cell organize from RNA-seq and single cell RNA-seq data. The usage is described as Fig. 4 and Fig. 5.
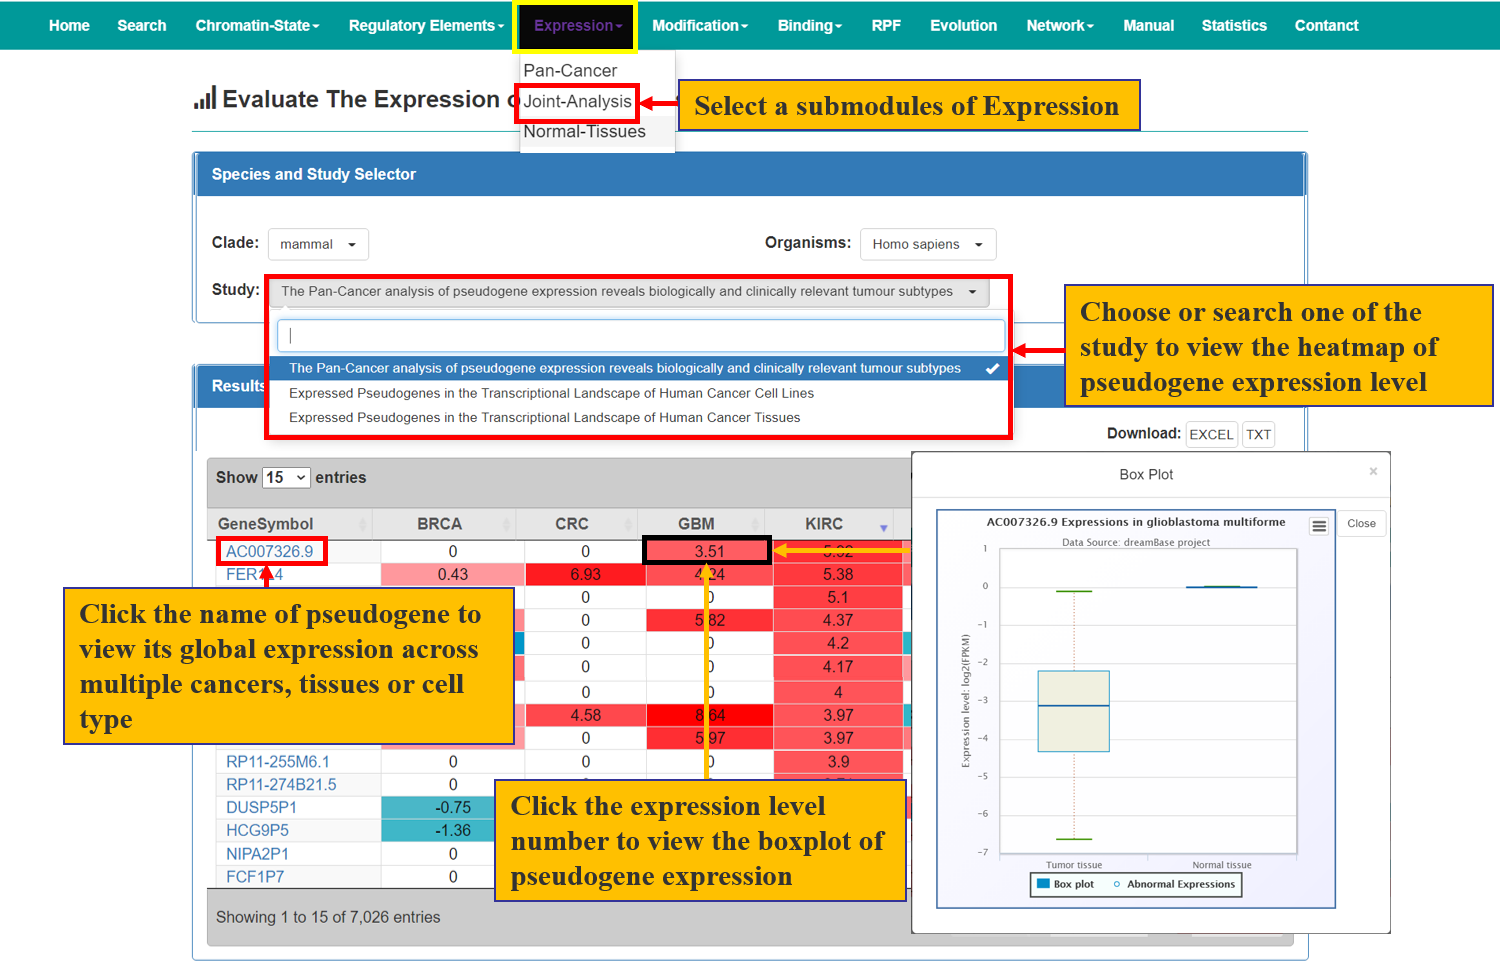
Fig. 4 The Usage of Expression Module
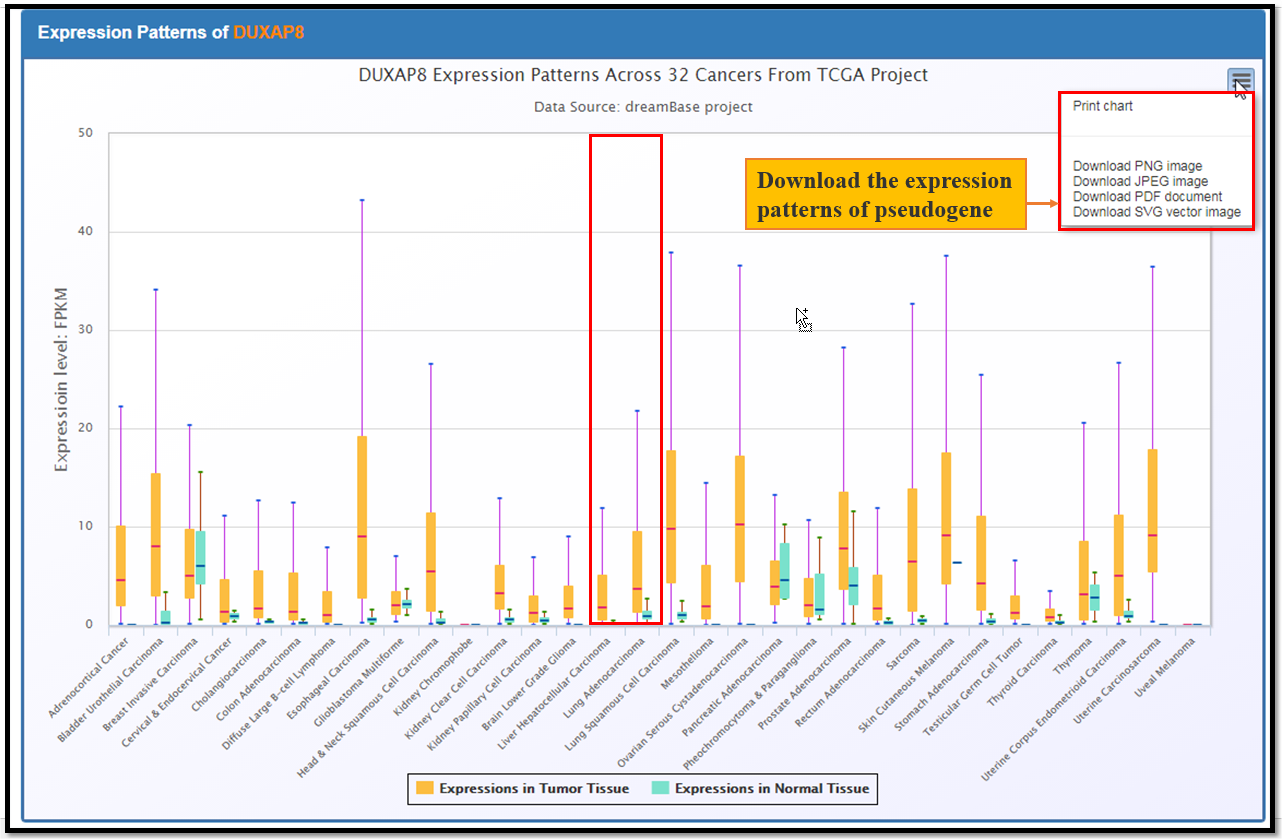
Fig. 5 The Exression Profiles of DUXAP8 Across 32 Cancers
Network
The Network Module provides two special web-based tools: coExp-pseudo, which is used to explore co-expression patterns between pseudogenes and their parent genes (Fig. 6), and ceRNA-pseudo, which is used to visualize the crosstalk between pseudogenes and their parent genes by competitive binding of microRNAs (Fig. 7 and Fig. 8).
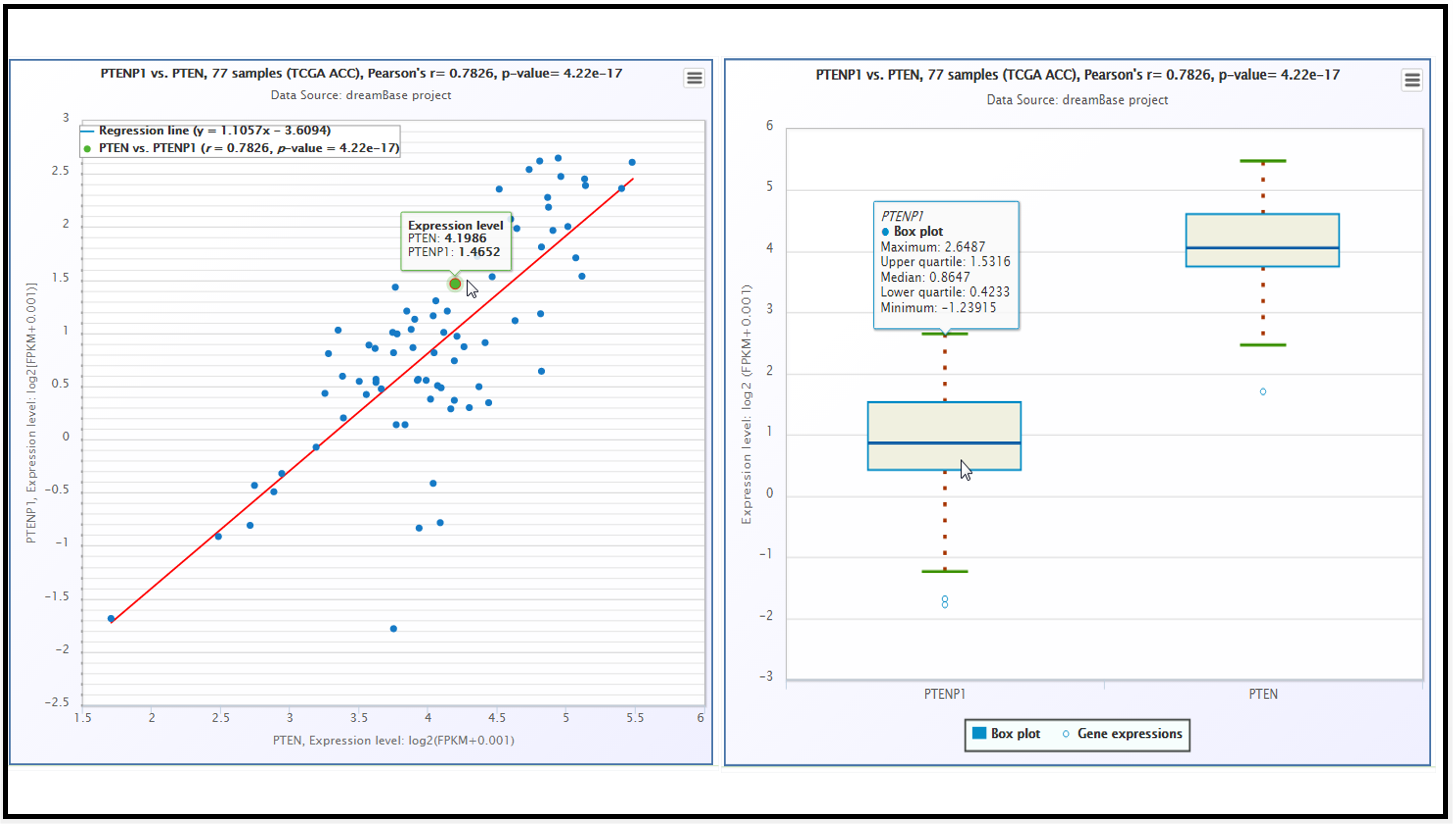
Fig. 6 The scatter plot and boxplot of co-expression patterns between ABCC6P1 pseudogene and its parent gene ABCC6.
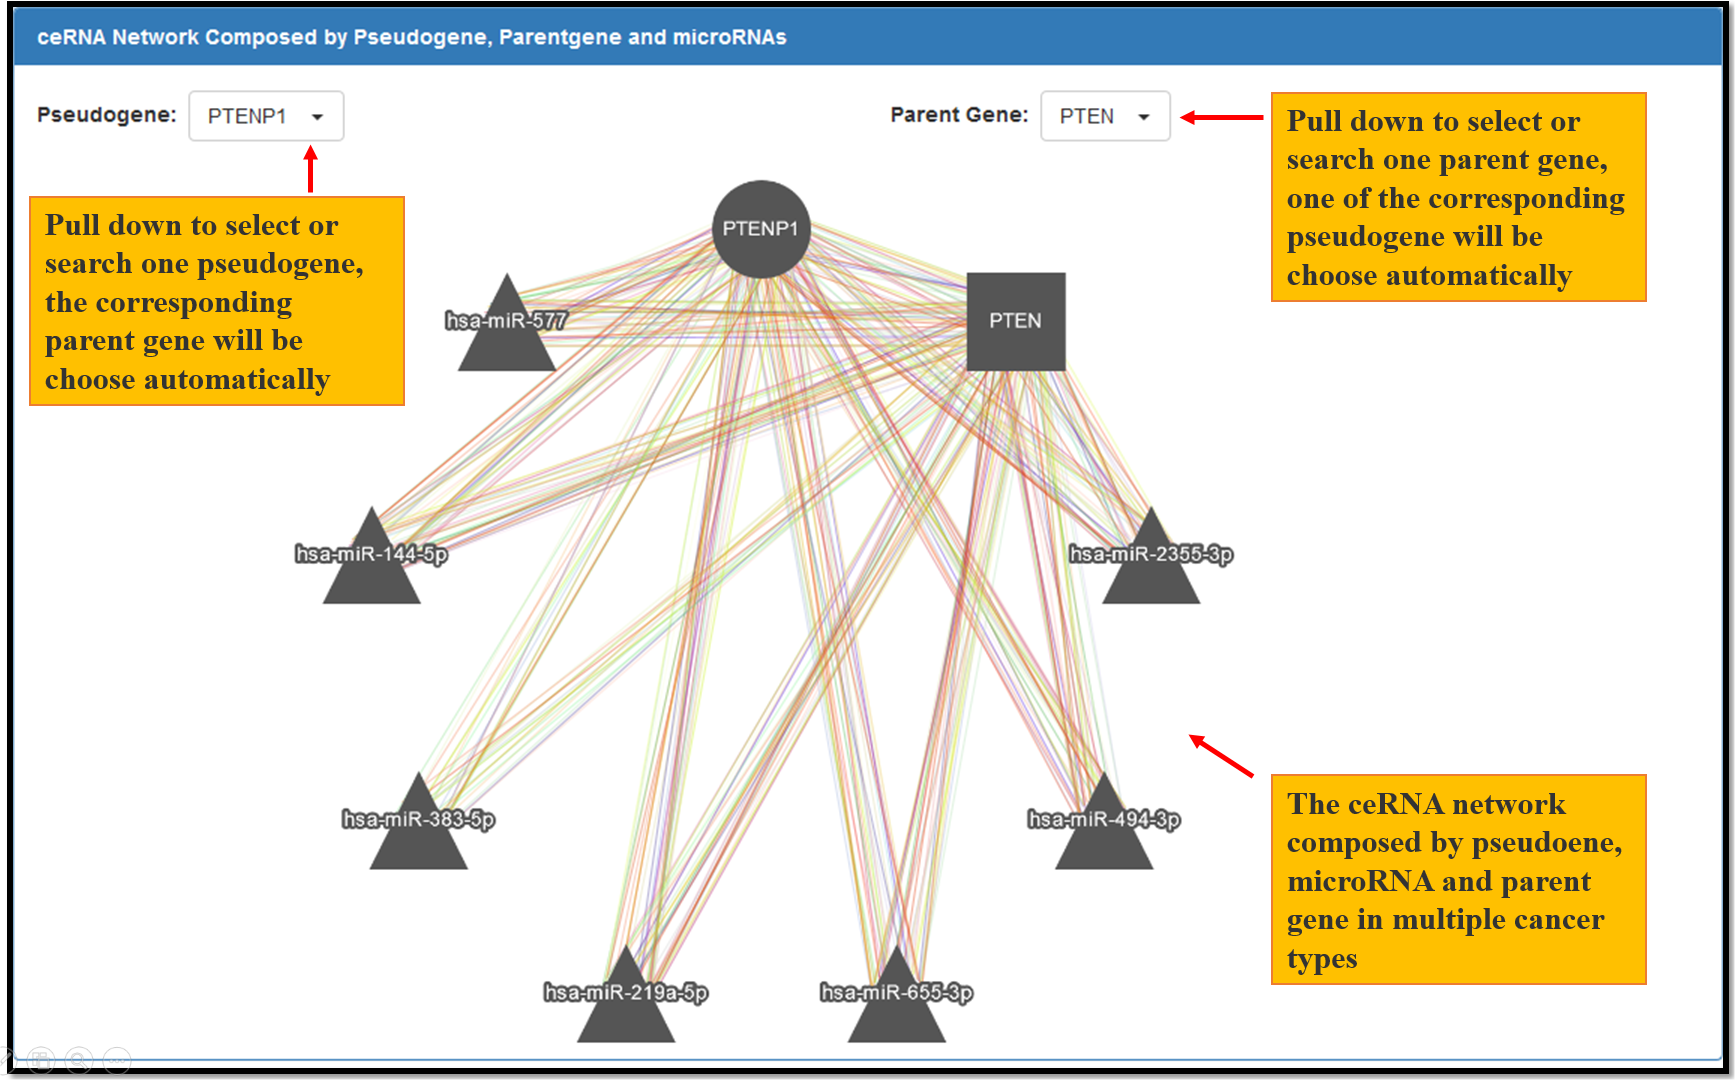
Fig. 7 The ceRNA network composed by pseudogene, microRNA and parent gene in multiple cancer types. Each node represents a gene, the circle node represents pseudogene, the square node represents parent gene and the triangle node represent microRNAs. Each edge represents a co-expression relationship between the two nodes in one type of the cancer. Different edge color represents different types of cancers.
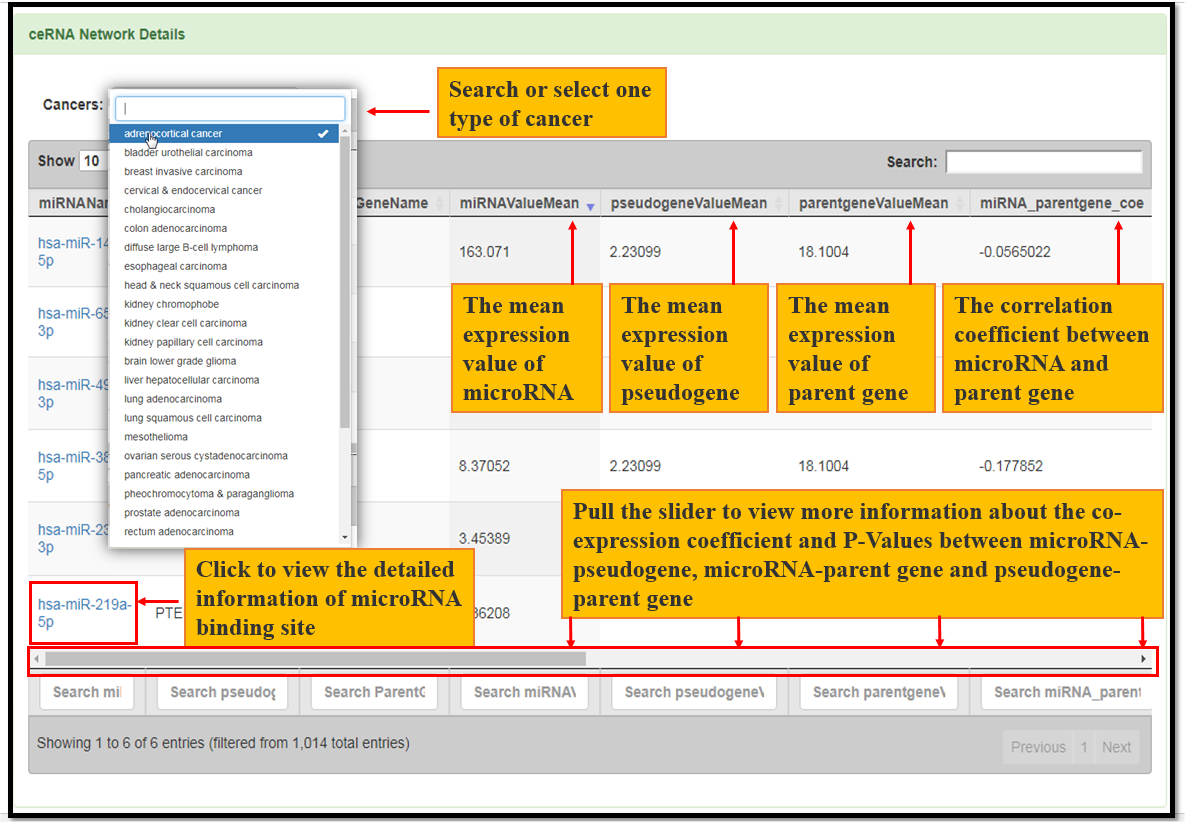
Fig. 8 The co-expression information of microRNA-pseudogene, microRNA-parentgene and pseudogene-parentgene in the ceRNA network.
Translation
In the Translation module, we described the translation landscape across multiple tissues or cells of pseudogenes mRNA using ribosome profiling (ribo-seq) data. It provides solid evidence whether the mRNAs translated into proteins or not. The results table shows gene's RPKM of expressed pseudoogenes acorss multiple tissues or cell lines. The details of usage can be found in the Translation page's "About" table.
Evolution
The Evolution module provides a evolution conservation relationship of expressed pseudogenes amoung six species, including Human, Mouse, Rat, Gorillas, Chicken and Zebrafish, using ucsc liftOver. The results table shows the conservation relationship of a specific pseudoogene amoung a certain species. The details of usage can be found in the Translation page's "About" table.